Overview
AURORA is a Fee Management System — a digital platform designed to streamline the management, calculation, and payment of various service fees, improving transparency, accuracy, and efficiency for both administrators and users.
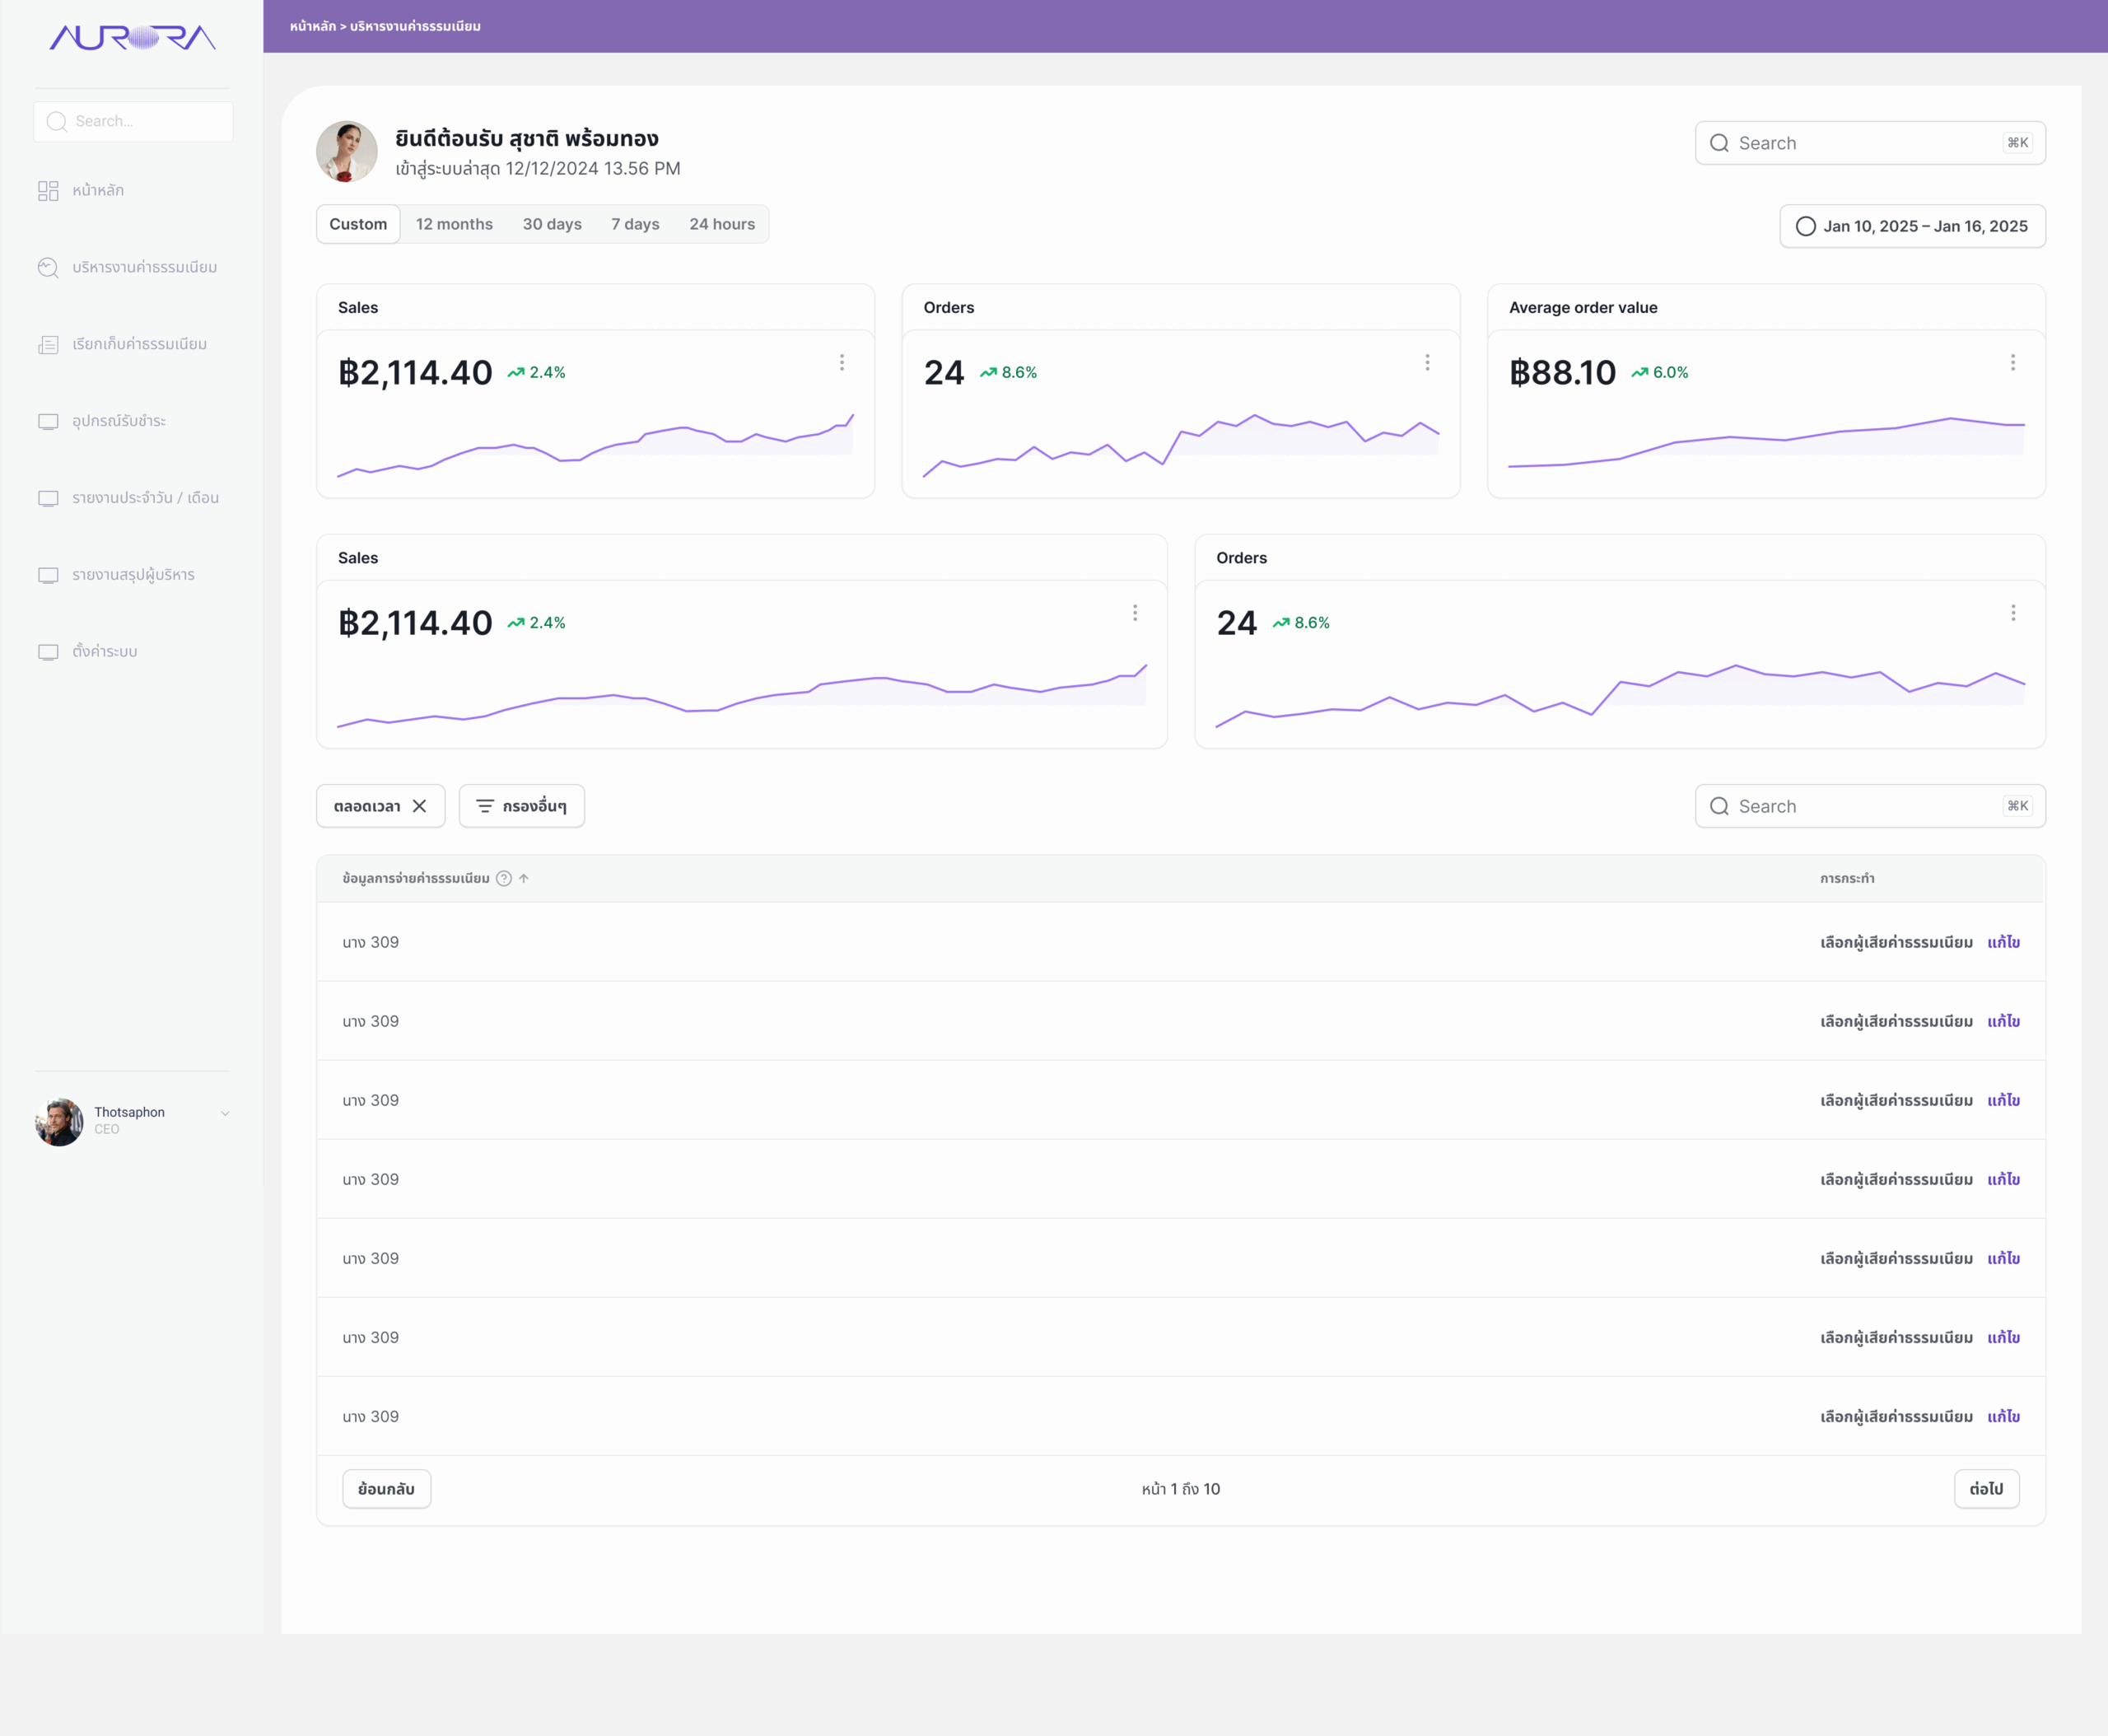
The platform brings every part of the fee lifecycle into one place: defining fee types and rates, billing and collecting payments, managing the payment devices used at service counters, and reporting results to executives. It also extends into field operations with a GIS map for locating waste bins and planning collection routes — the service many of these fees pay for.
Problem
Fees were calculated, collected, and reported through separate manual steps. Every hand-off was a chance for error — and a reason for people to ask, "What do I owe, and has it been paid?"
Fee rules differ by type, rate method, effective period, and the legal announcement behind them. When staff apply those rules by hand, calculations drift and receipts lag behind payments. Payers get little visibility into what they are being charged or why, while administrators struggle to see collection performance across offices and payment channels until a report is compiled at month-end.
- Fee calculation relied on staff applying rules manually.
- Payers had no clear, accessible view of their fees and payment status.
- Receipts and invoices were produced separately from the payment itself.
- Executives lacked a timely, consolidated view of revenue and outstanding items.
Make every fee clear, correct, and trackable.
Simplify calculation & payment
Turn a multi-step manual process into a guided flow where the system does the maths and the user confirms.
Clear, accessible fee information
Show what each fee is, how it was calculated, and where it stands — in plain language, on any device.
Reduce human error
Encode fee rules once, validate inputs at entry, and remove re-typing between calculation, billing, and receipts.
Real-time status & receipts
Track each transaction from billed to paid in real time, and issue an official receipt the moment payment clears.
Research
I conducted user research with both staff and end-users to identify their pain points and expectations before designing any screens.
Talking to both sides of the counter mattered: staff care about speed, accuracy, and not being blamed for a wrong number; payers care about understanding the charge and getting proof of payment. Mapping these needs side by side shaped the information architecture and the priority of every dashboard.
Information Architecture
Navigation was organized around the fee lifecycle — set up, bill, collect, report — so each menu answers one question.
A persistent left sidebar keeps the seven core areas one click away, with breadcrumbs at the top of every page so staff always know where they are.
- หน้าหลักHome
Personal summary and recent fee records.
- บริหารงานค่าธรรมเนียมFee Administration
Fee types, rates, revenue, and approvals.
- เรียกเก็บค่าธรรมเนียมFee Billing
Transactions, payment status, and details.
- อุปกรณ์รับชำระPayment Devices
EDC and QR devices, map, maintenance, history.
- รายงานประจำวัน / เดือนDaily / Monthly Reports
Revenue, volume, and trends over time.
- รายงานสรุปผู้บริหารExecutive Summary
High-level performance for decision makers.
- ตั้งค่าระบบSettings
User roles, access permissions, and configuration.
Wireframes
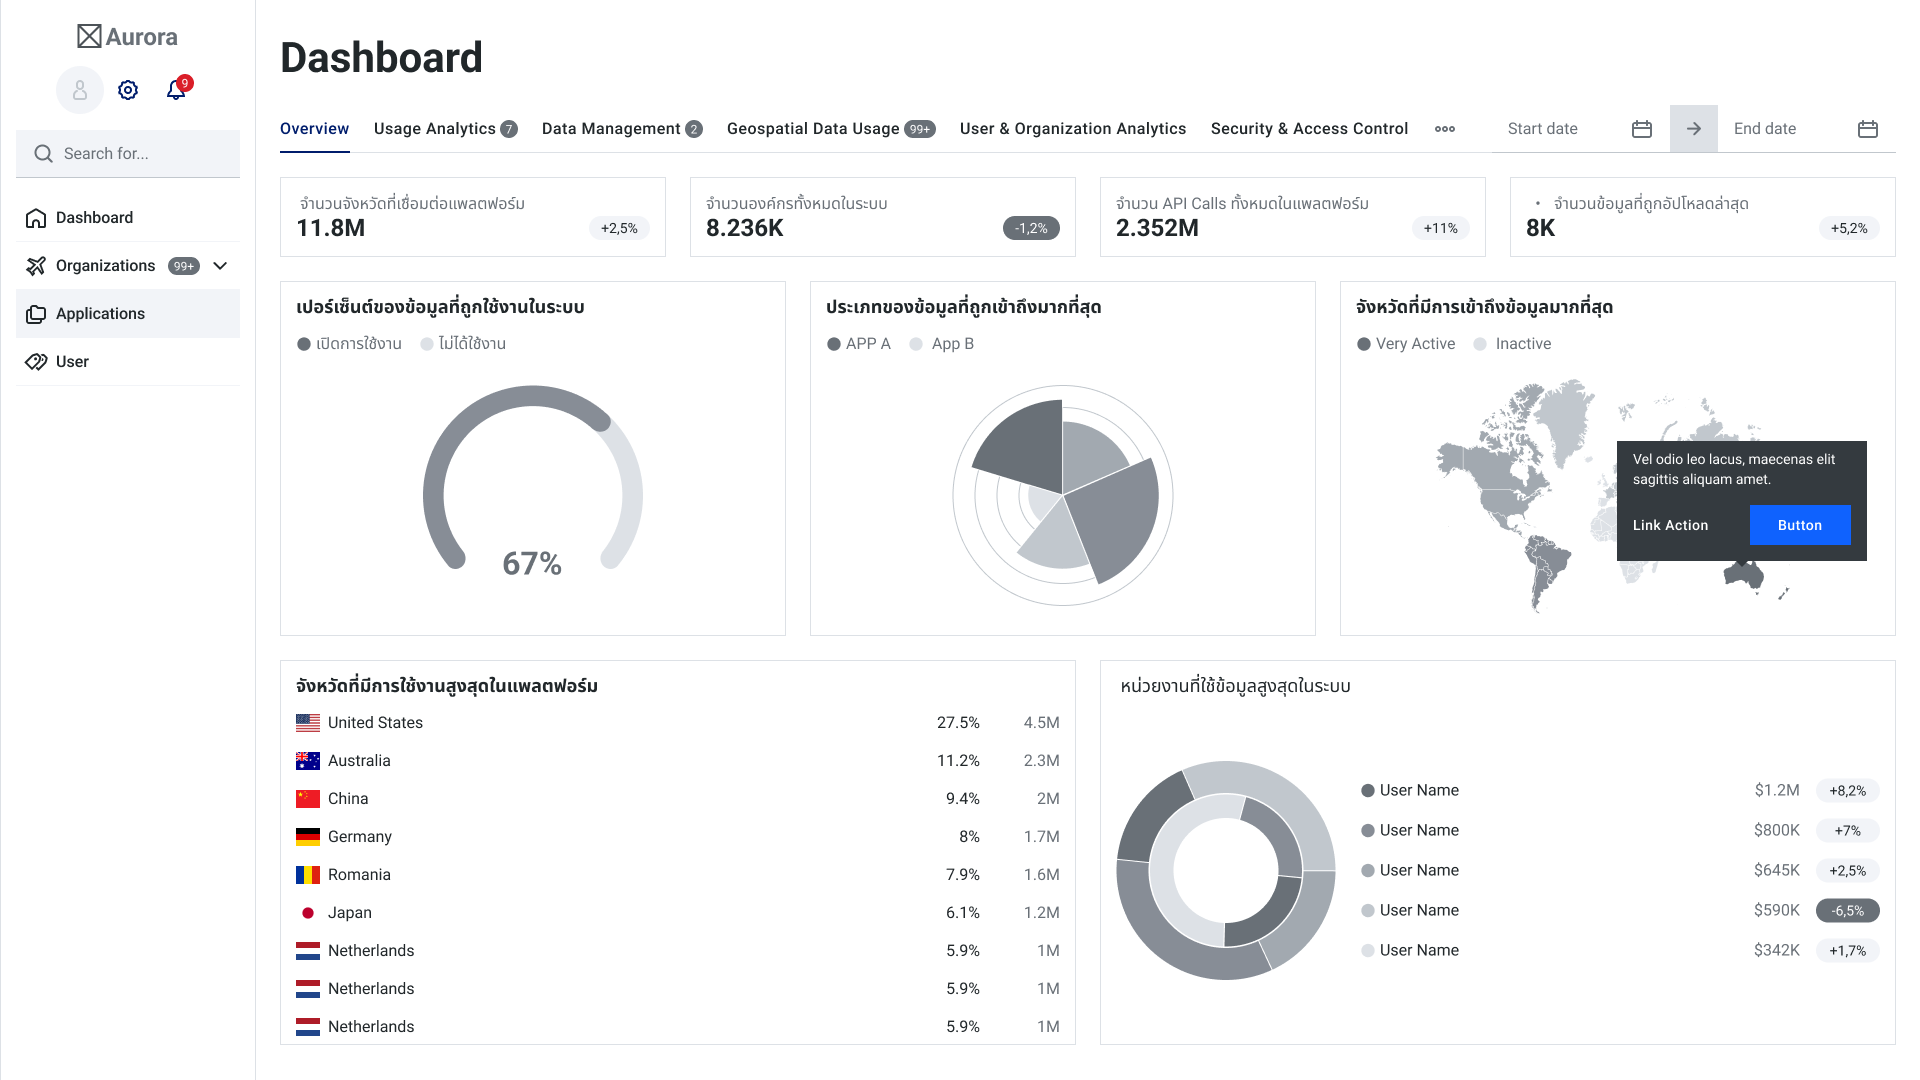
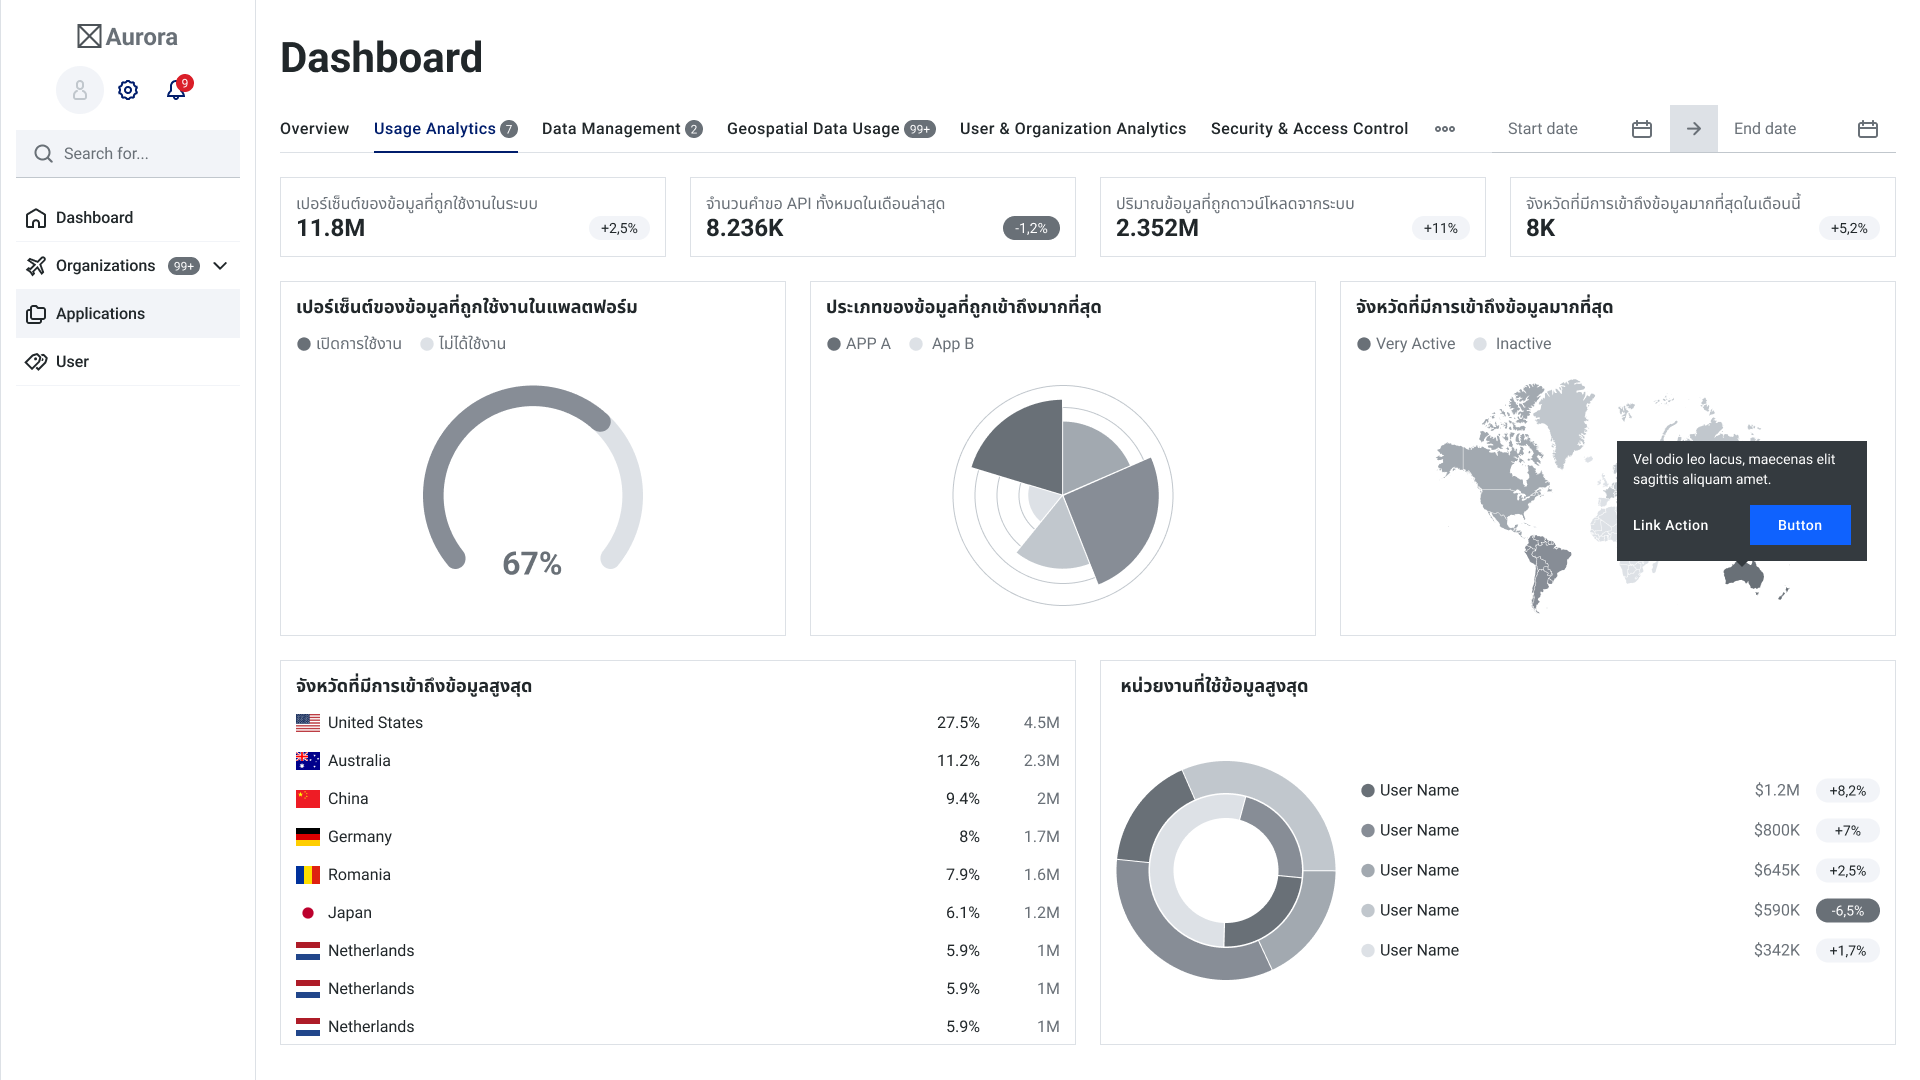
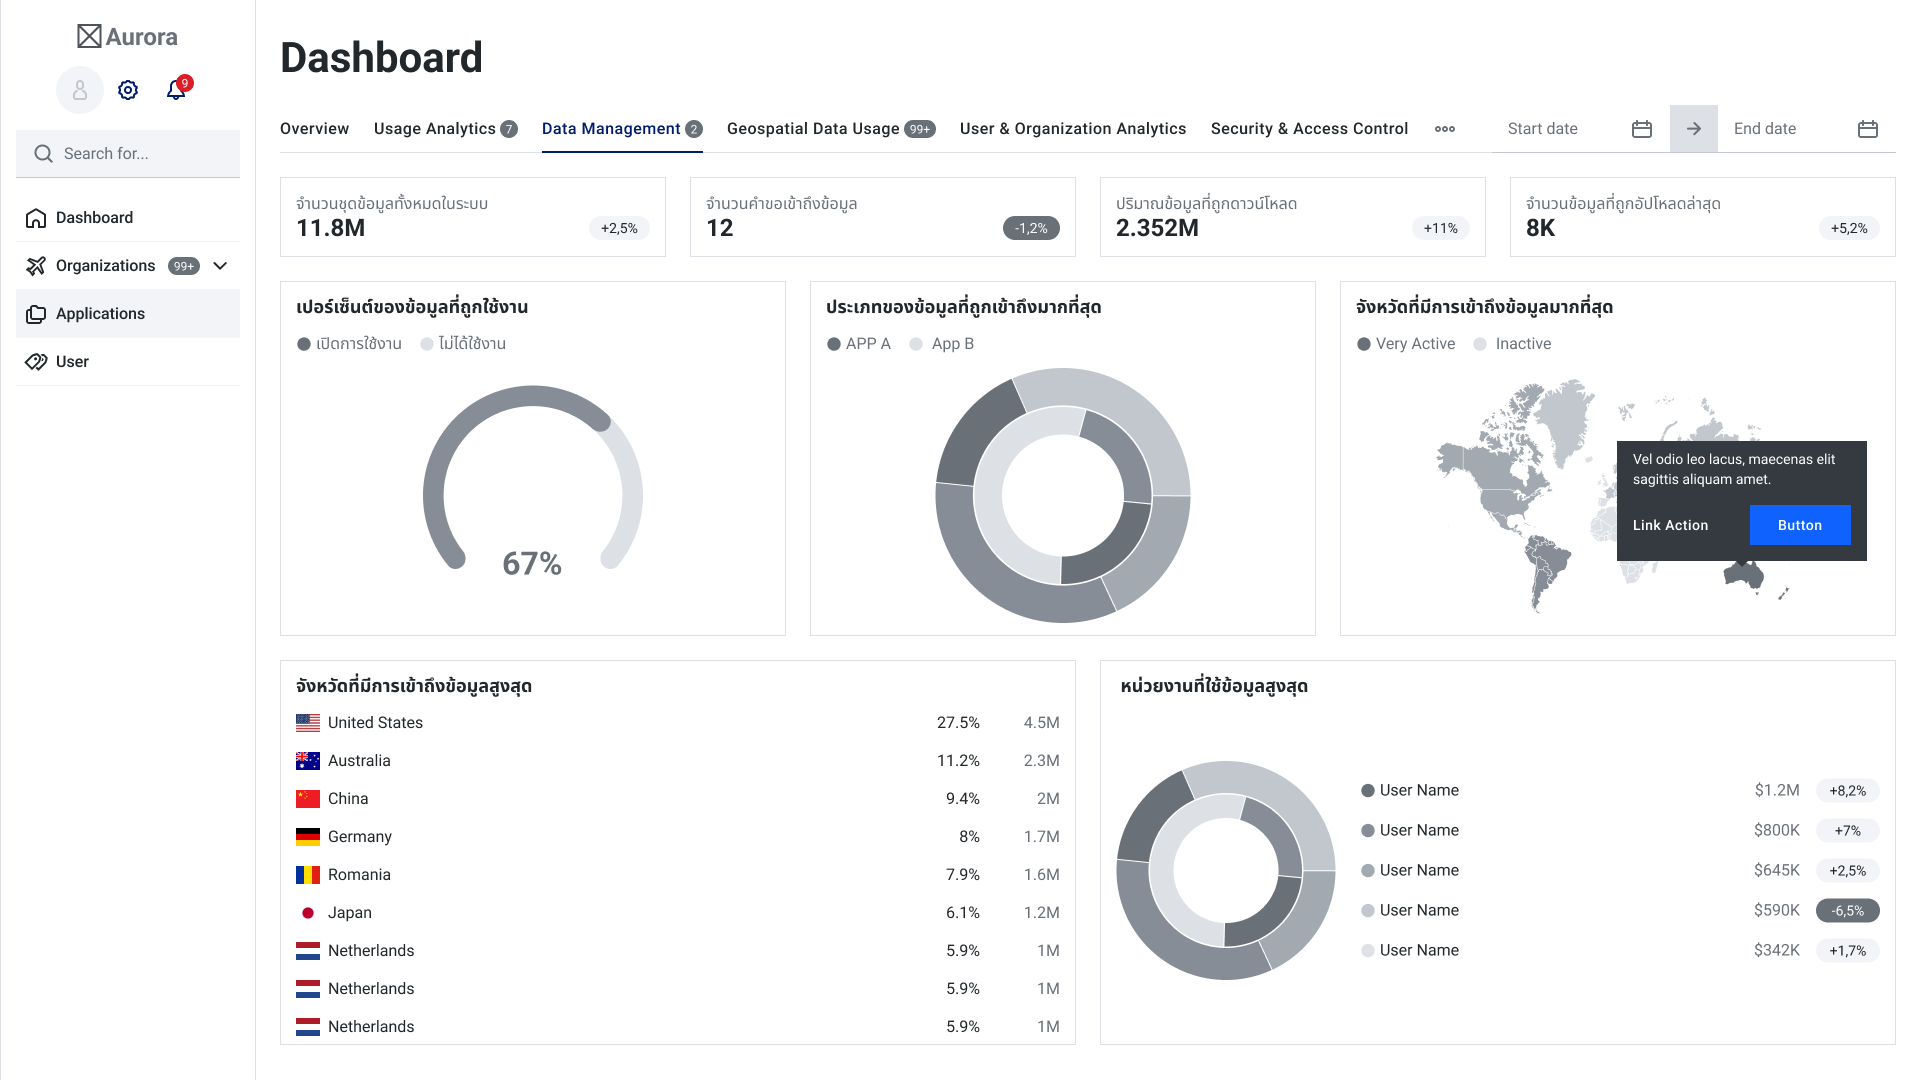
An iterative process — low-fidelity wireframes first, then high-fidelity prototypes tested with stakeholders.
Greyscale dashboards let stakeholders debate structure and metrics without being distracted by colour. Tabs for Overview, Usage Analytics, Data Management, Geospatial Data Usage, User & Organization Analytics, and Security & Access Control were tested for naming and order before visual design began.
 Dashboard — Overview
 Dashboard — Usage Analytics
 Dashboard — Data Management
Key Features
Six core modules, each designed around the one job its users come to do.
Secure access & user management
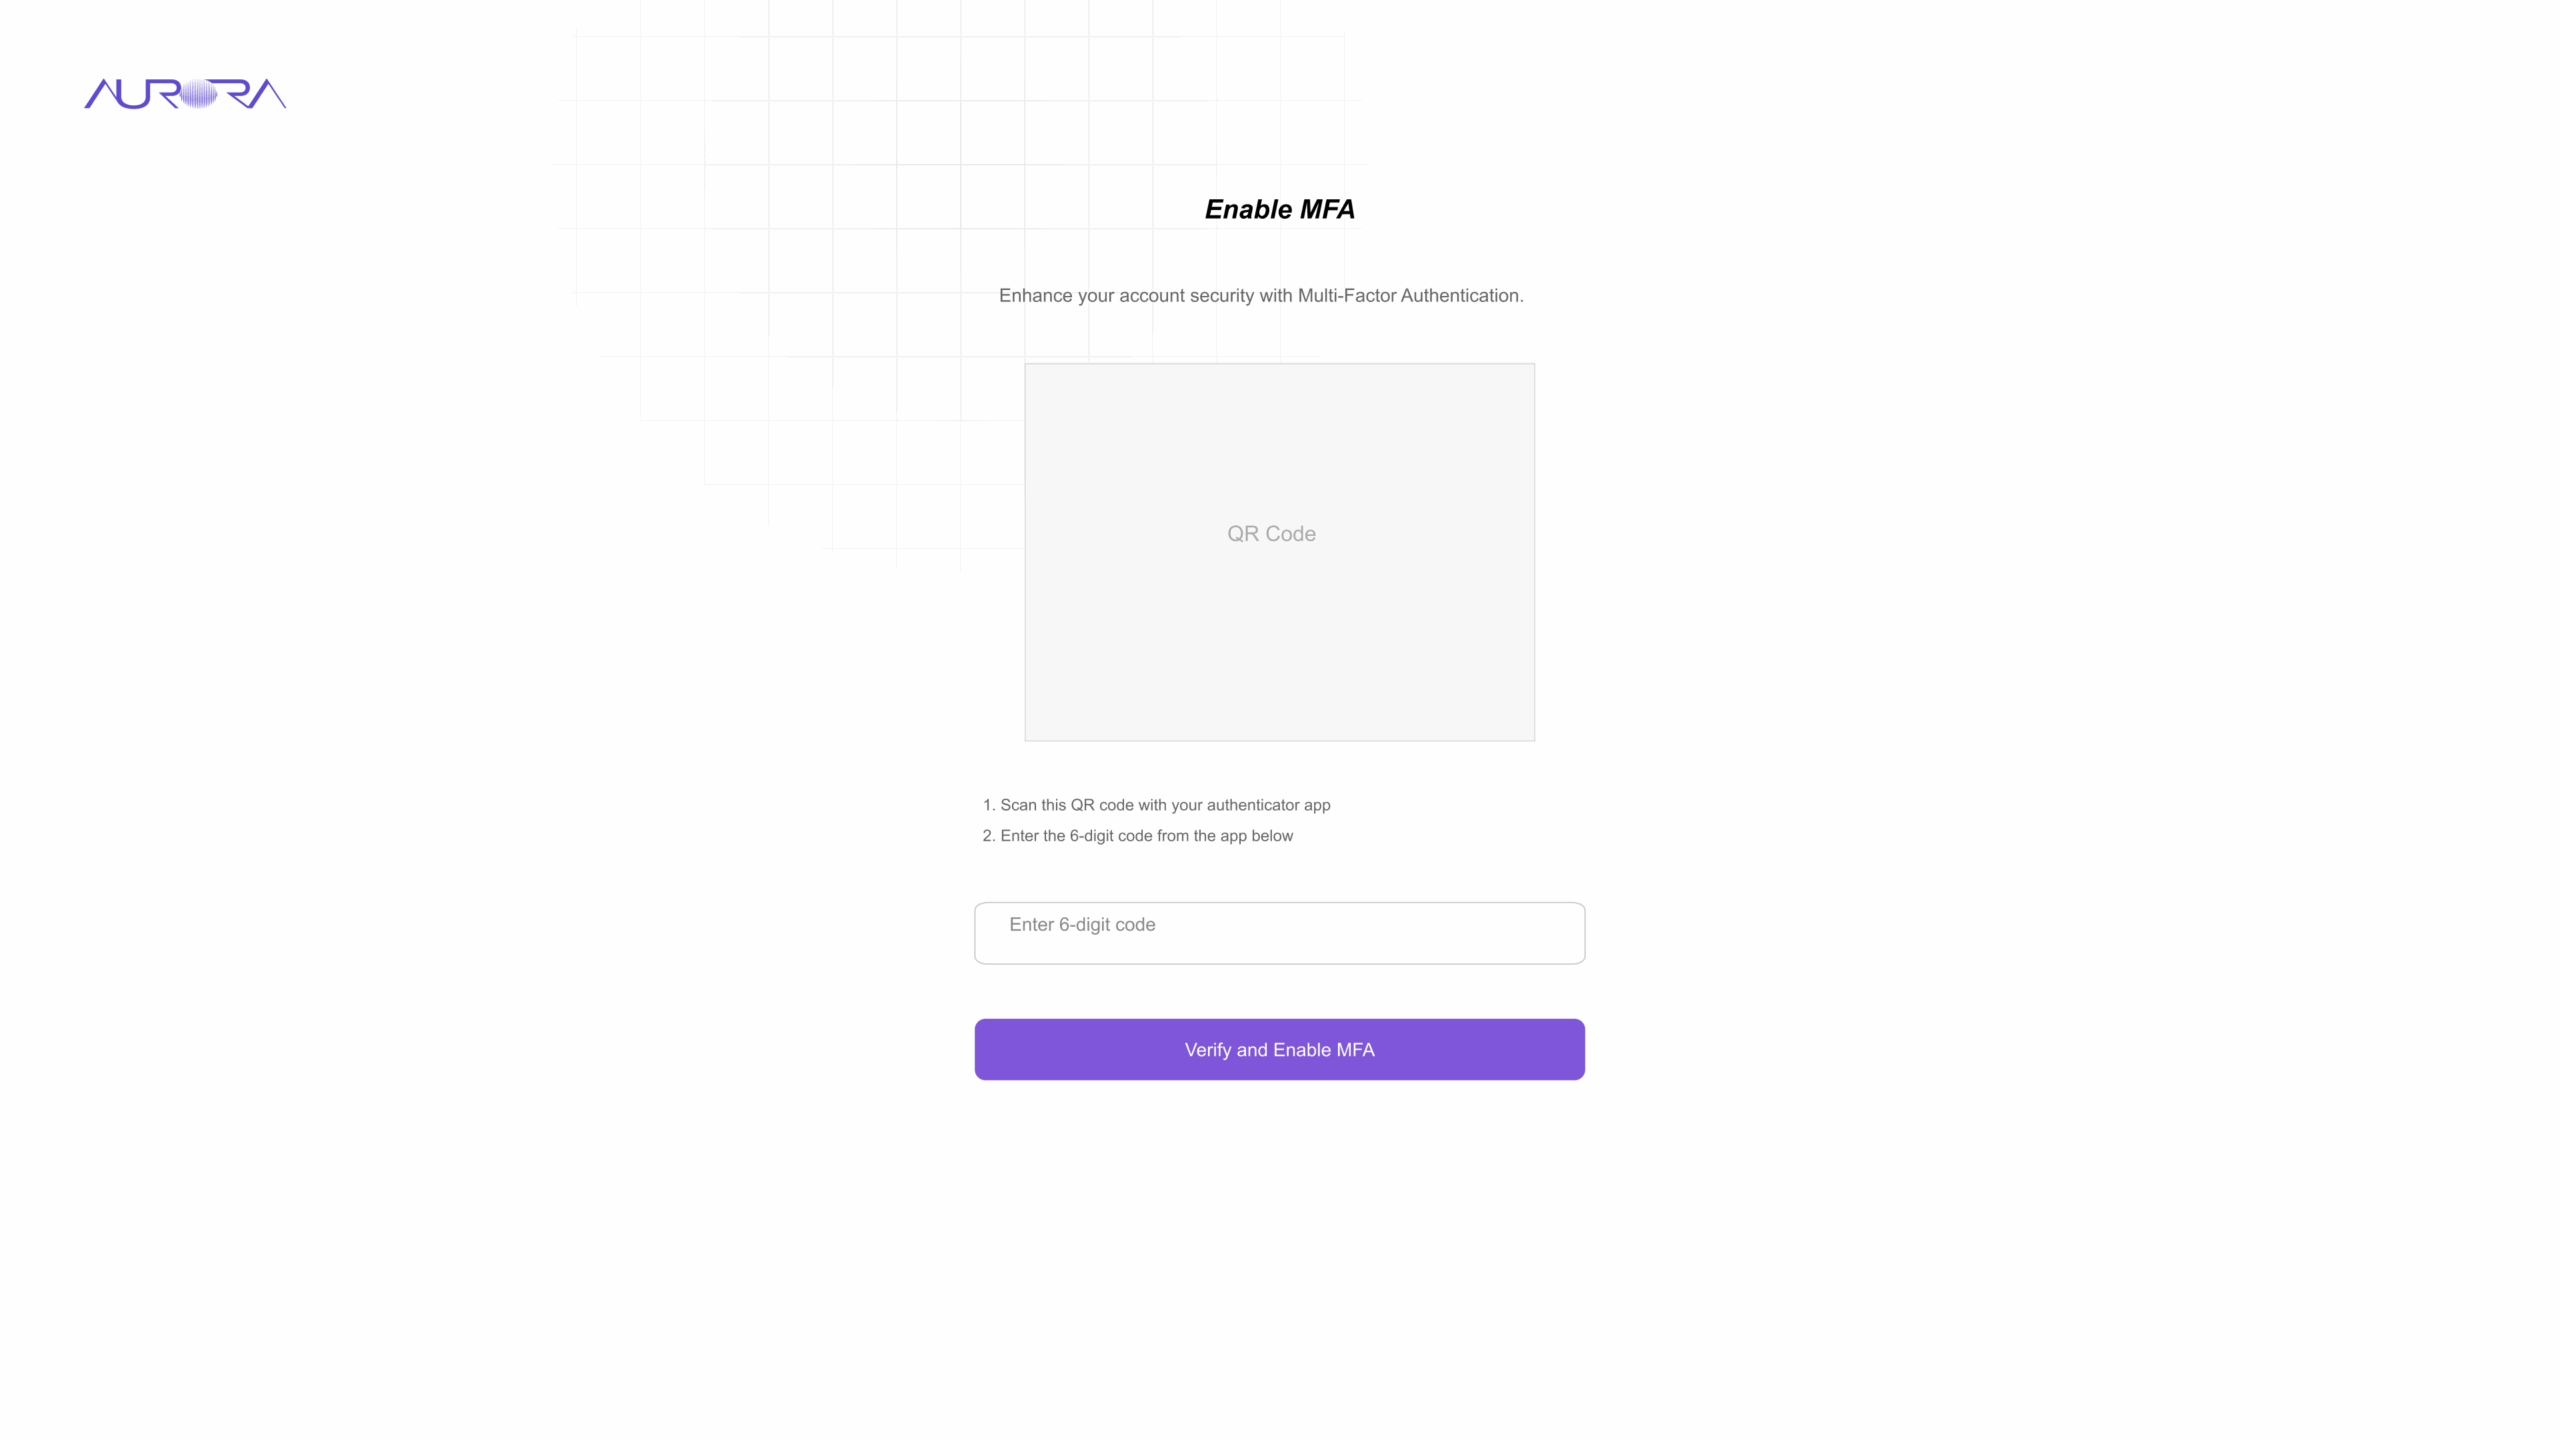
Financial data demands strong access control. Staff sign in with email or their organization's Azure account, then enable multi-factor authentication by scanning a QR code with an authenticator app.
Behind the login, User Management lets administrators assign roles and access permissions so each person only sees the modules they are responsible for.
Screens — Login and MFA setup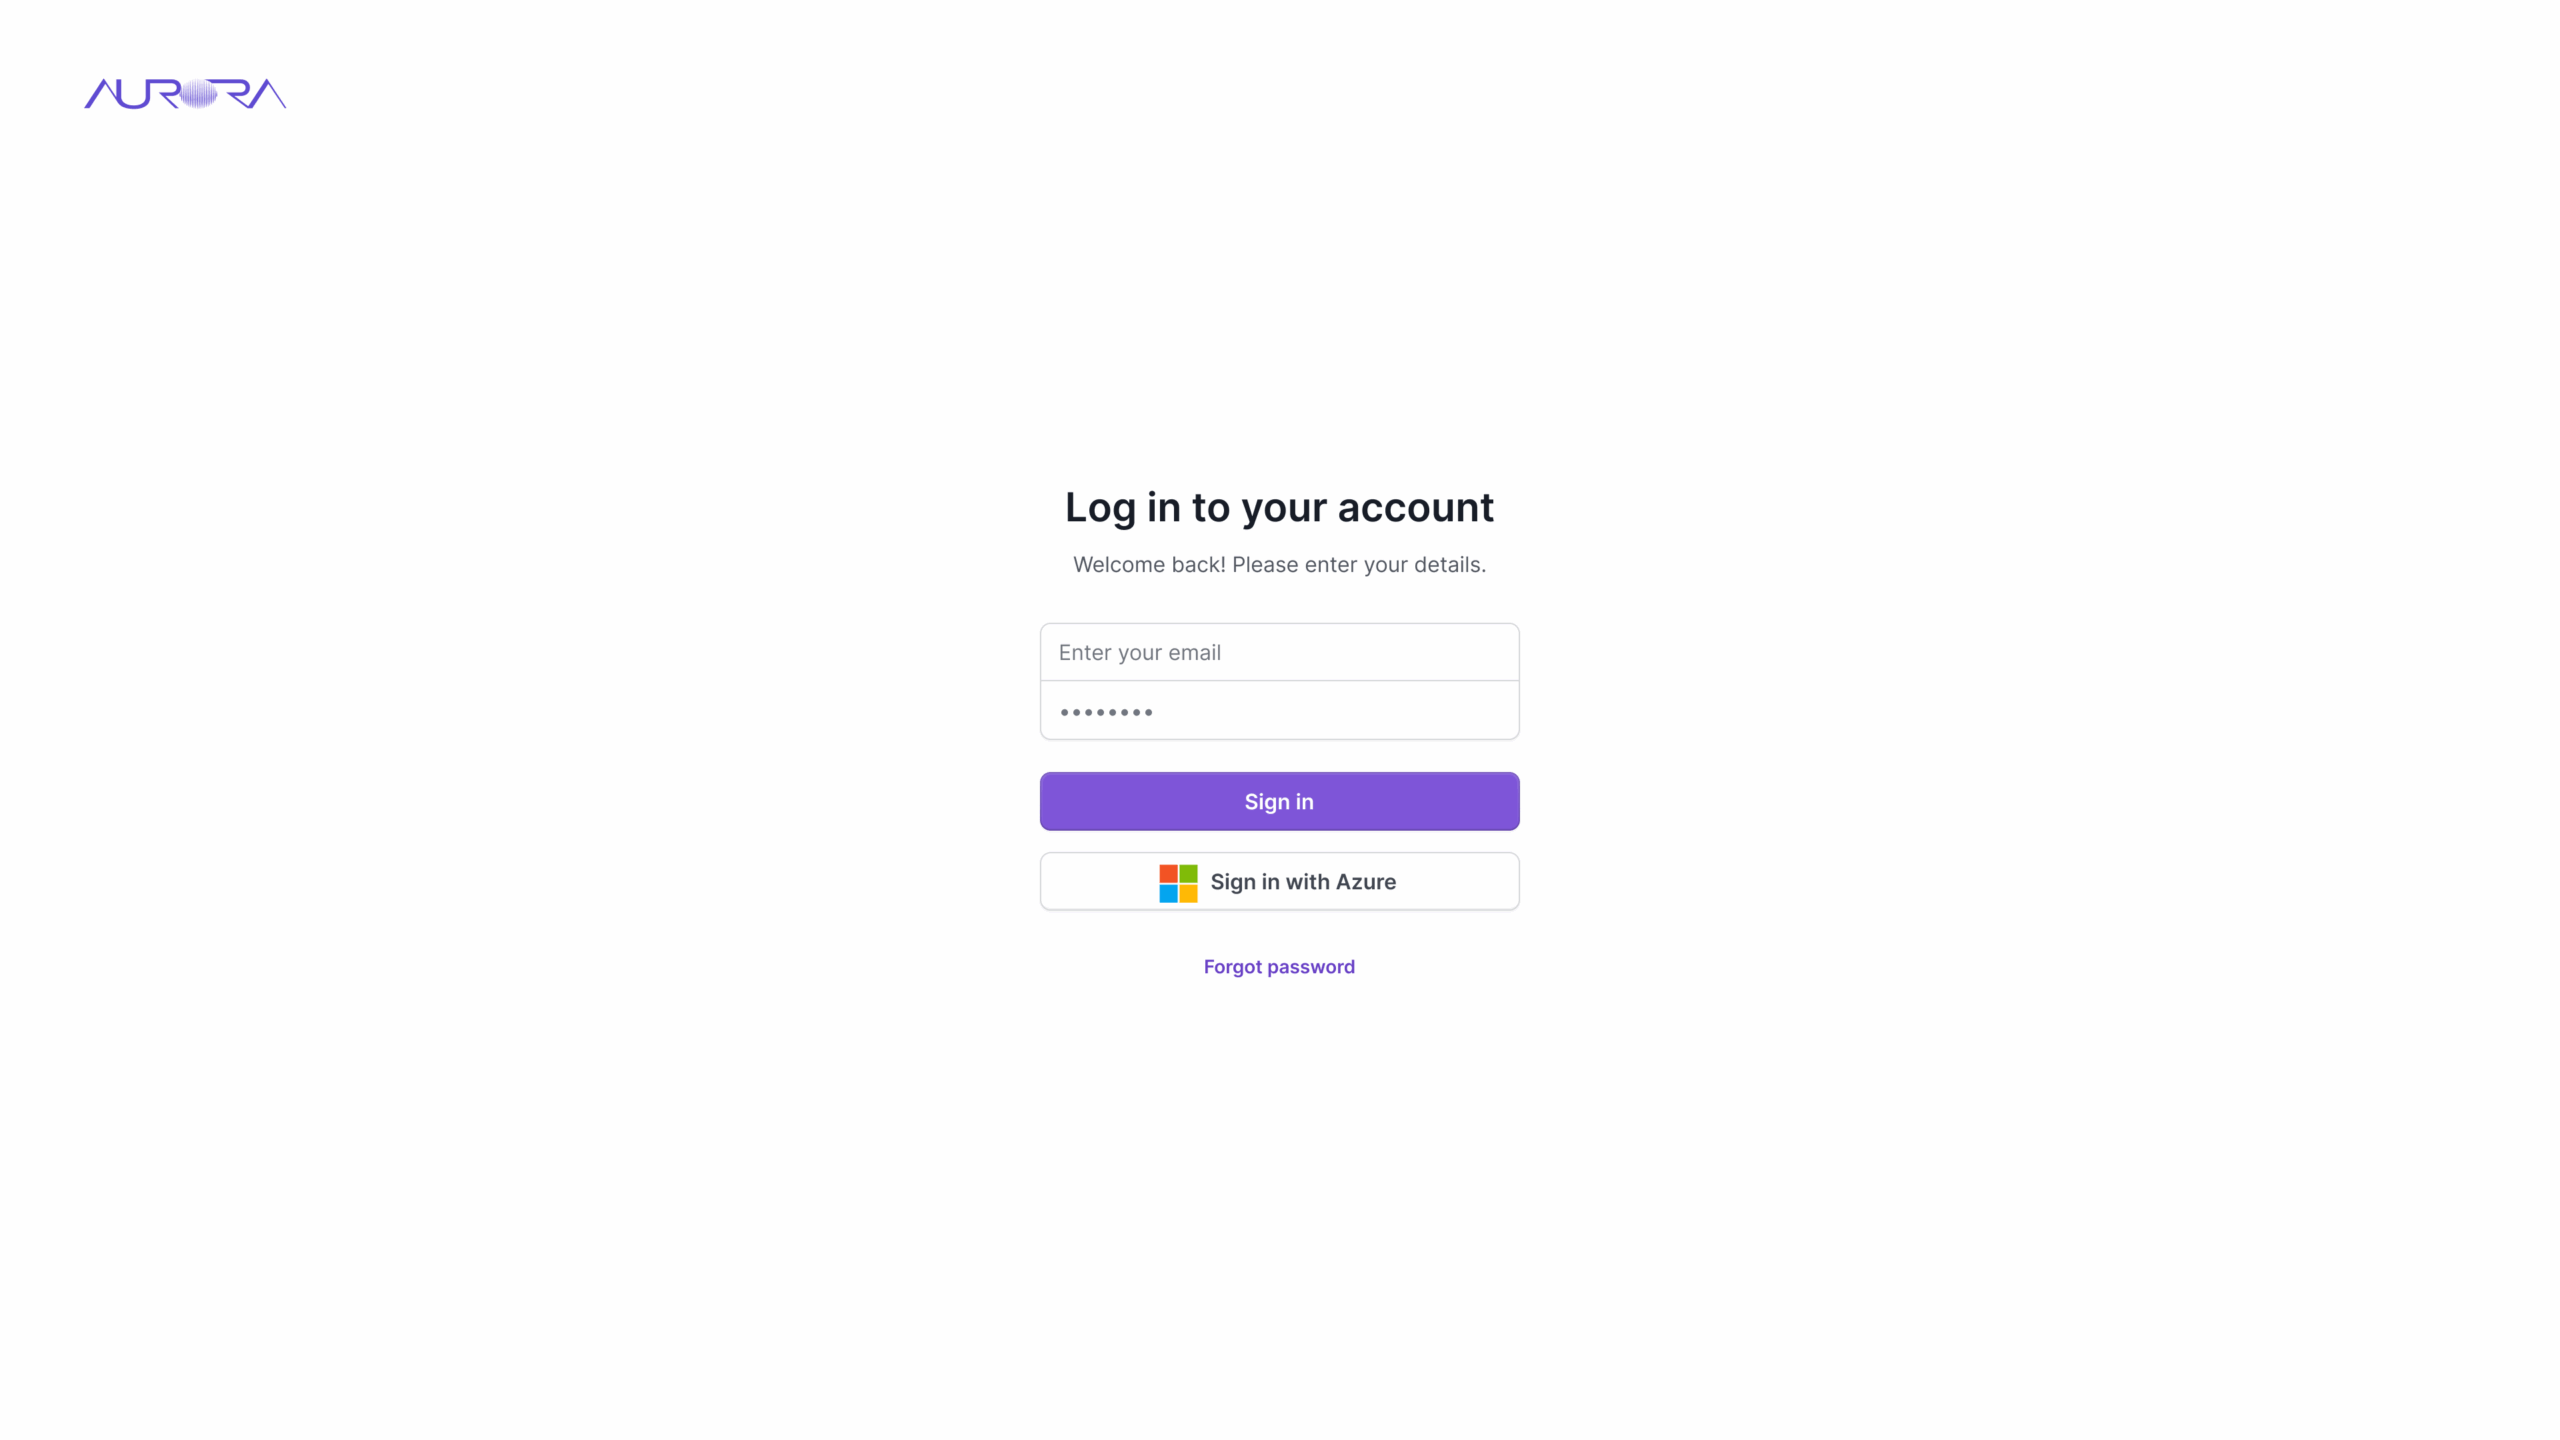
Dashboard overview & fee administration
The fee administration dashboard displays a fee summary, payment status, and notifications: total and monthly revenue, today's transactions, number of fee types, connected agencies, and reports awaiting approval — highlighted in red so they are never missed.
A revenue ratio chart and a 12-month trend with year-over-year comparison sit above a searchable, filterable list of fee records.
Screen — บริหารงานค่าธรรมเนียม / Fee administration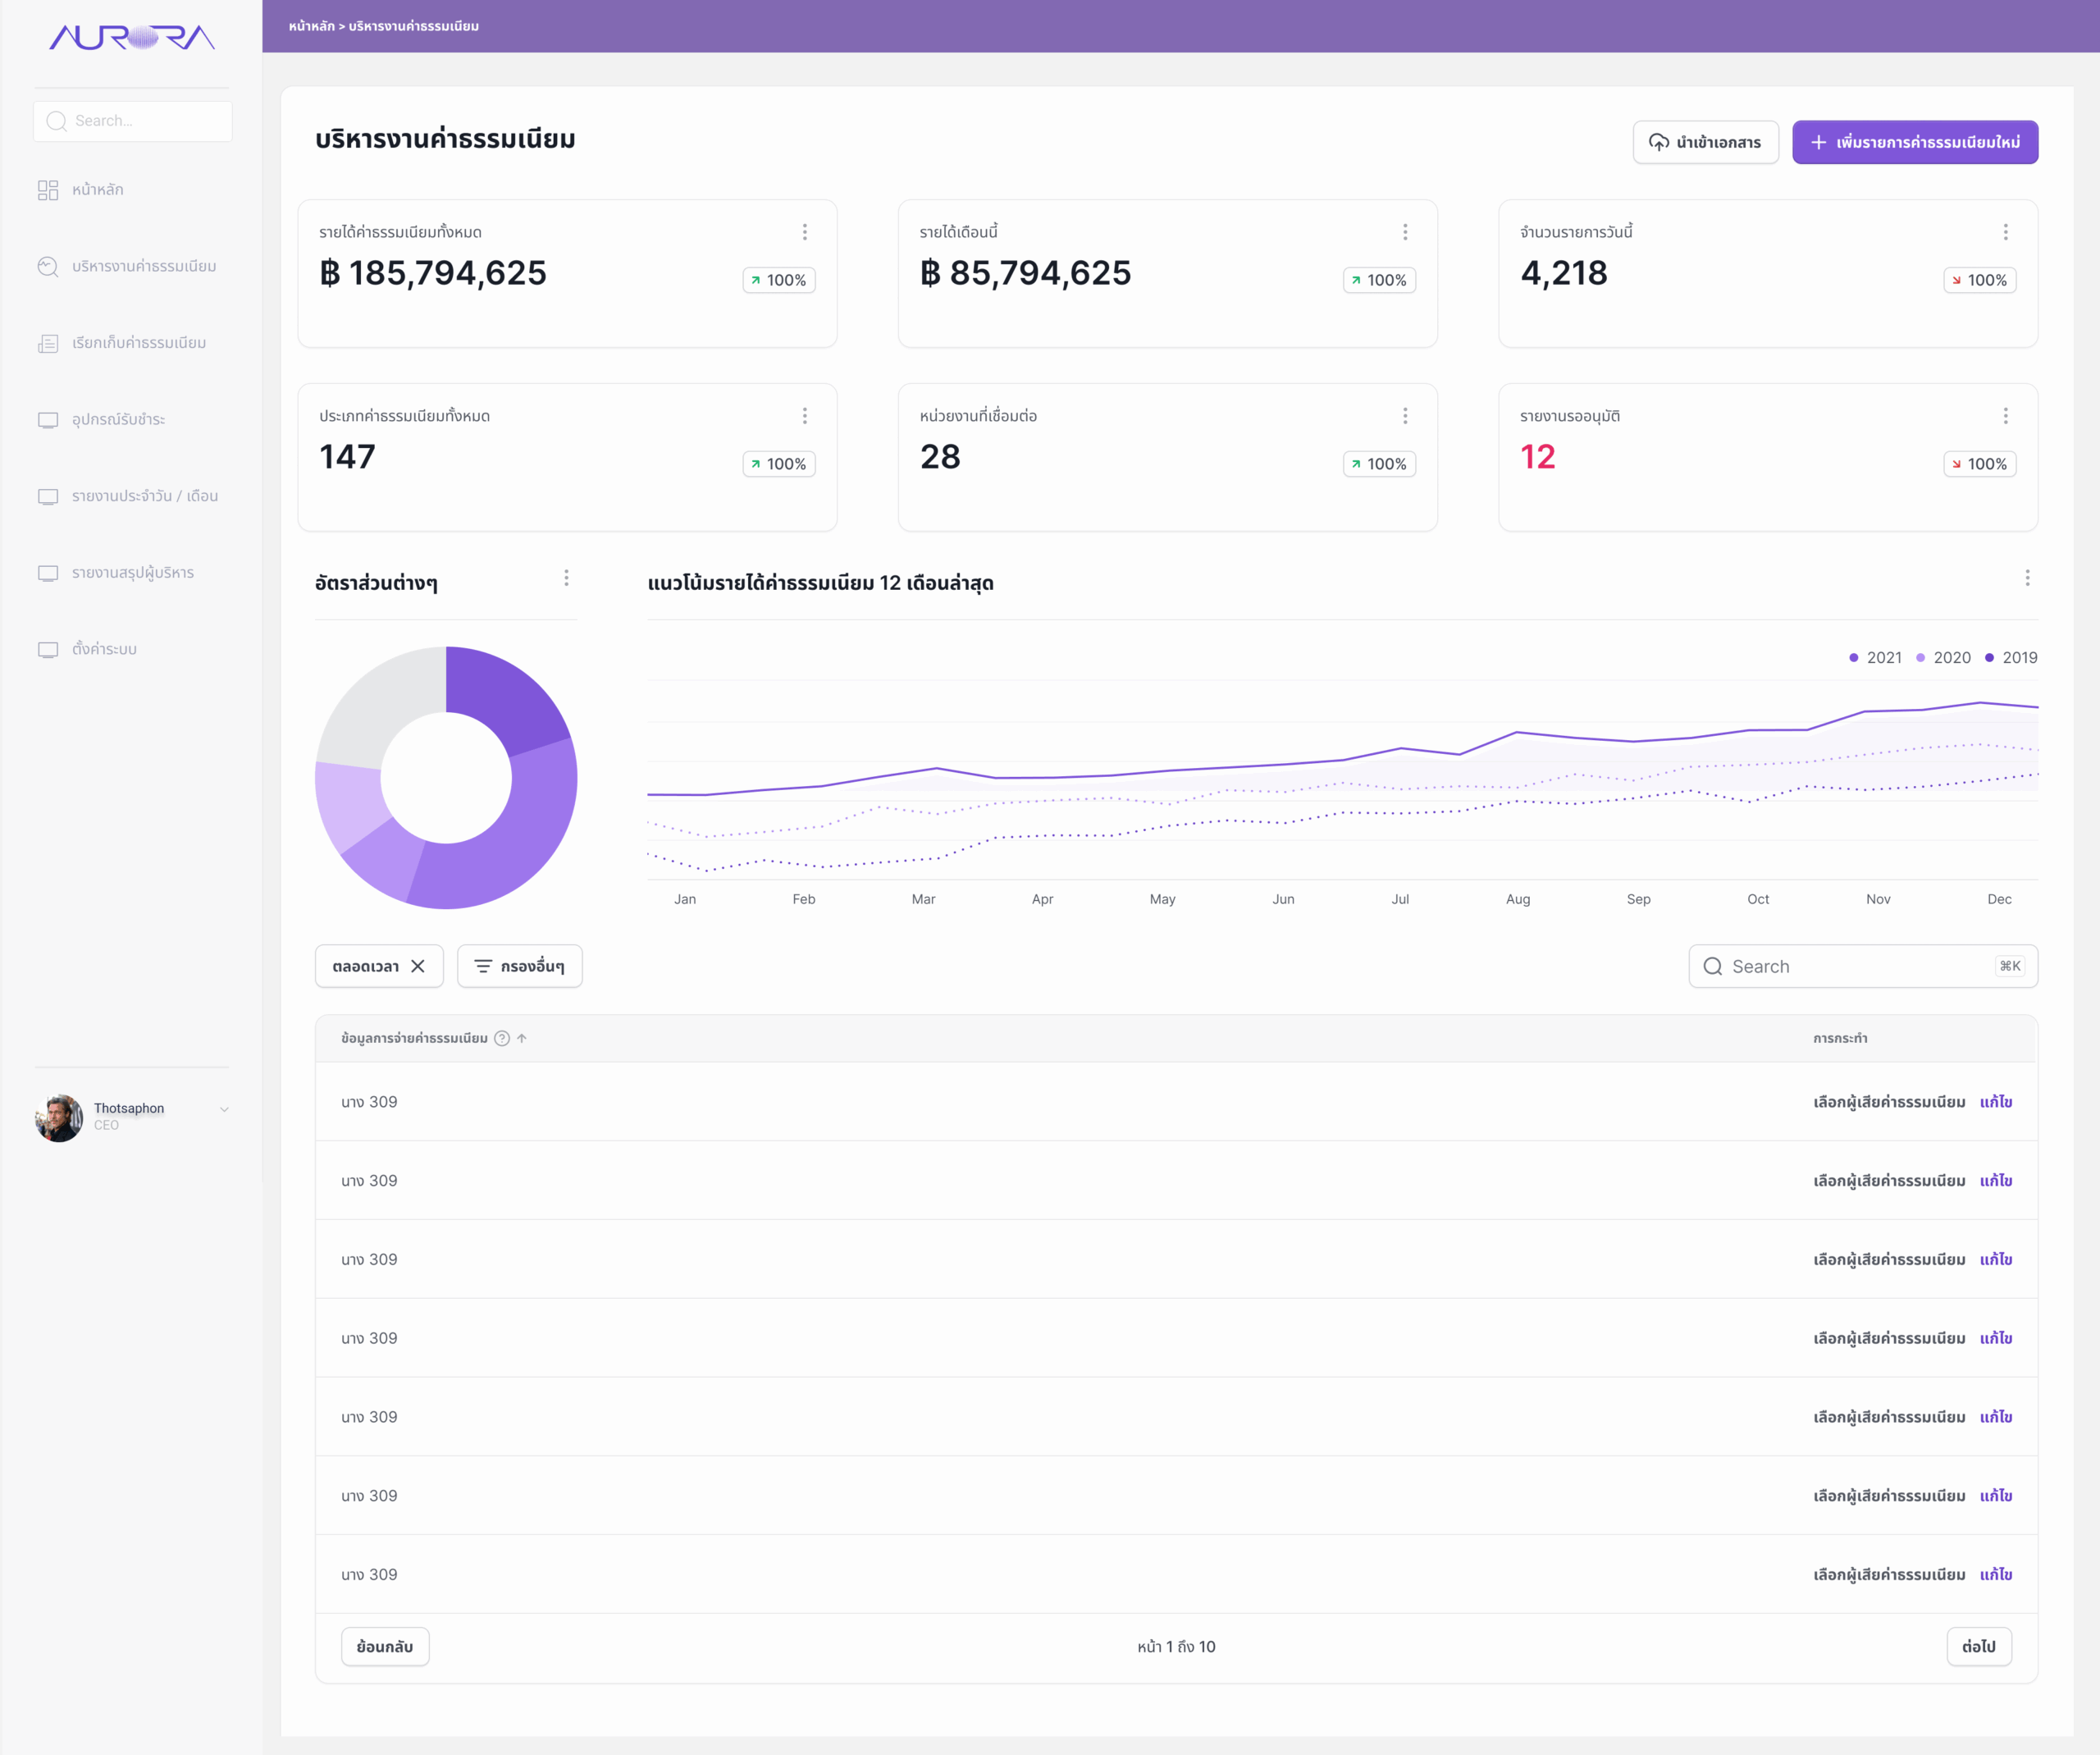
Fee calculation module
Fees are calculated automatically from predefined rules and user inputs. The form is split into clear groups: fee details (auto-generated fee code, name, type, responsible agency, status), rate information (rate method, rate, calculation conditions), the enforcement period with its legal reference, and notes.
Every field carries helper text and a tooltip, required fields are marked, and a confirmation bar asks "Save this data?" before anything is committed.
Screen — กรอกข้อมูลค่าธรรมเนียม / Fee entry form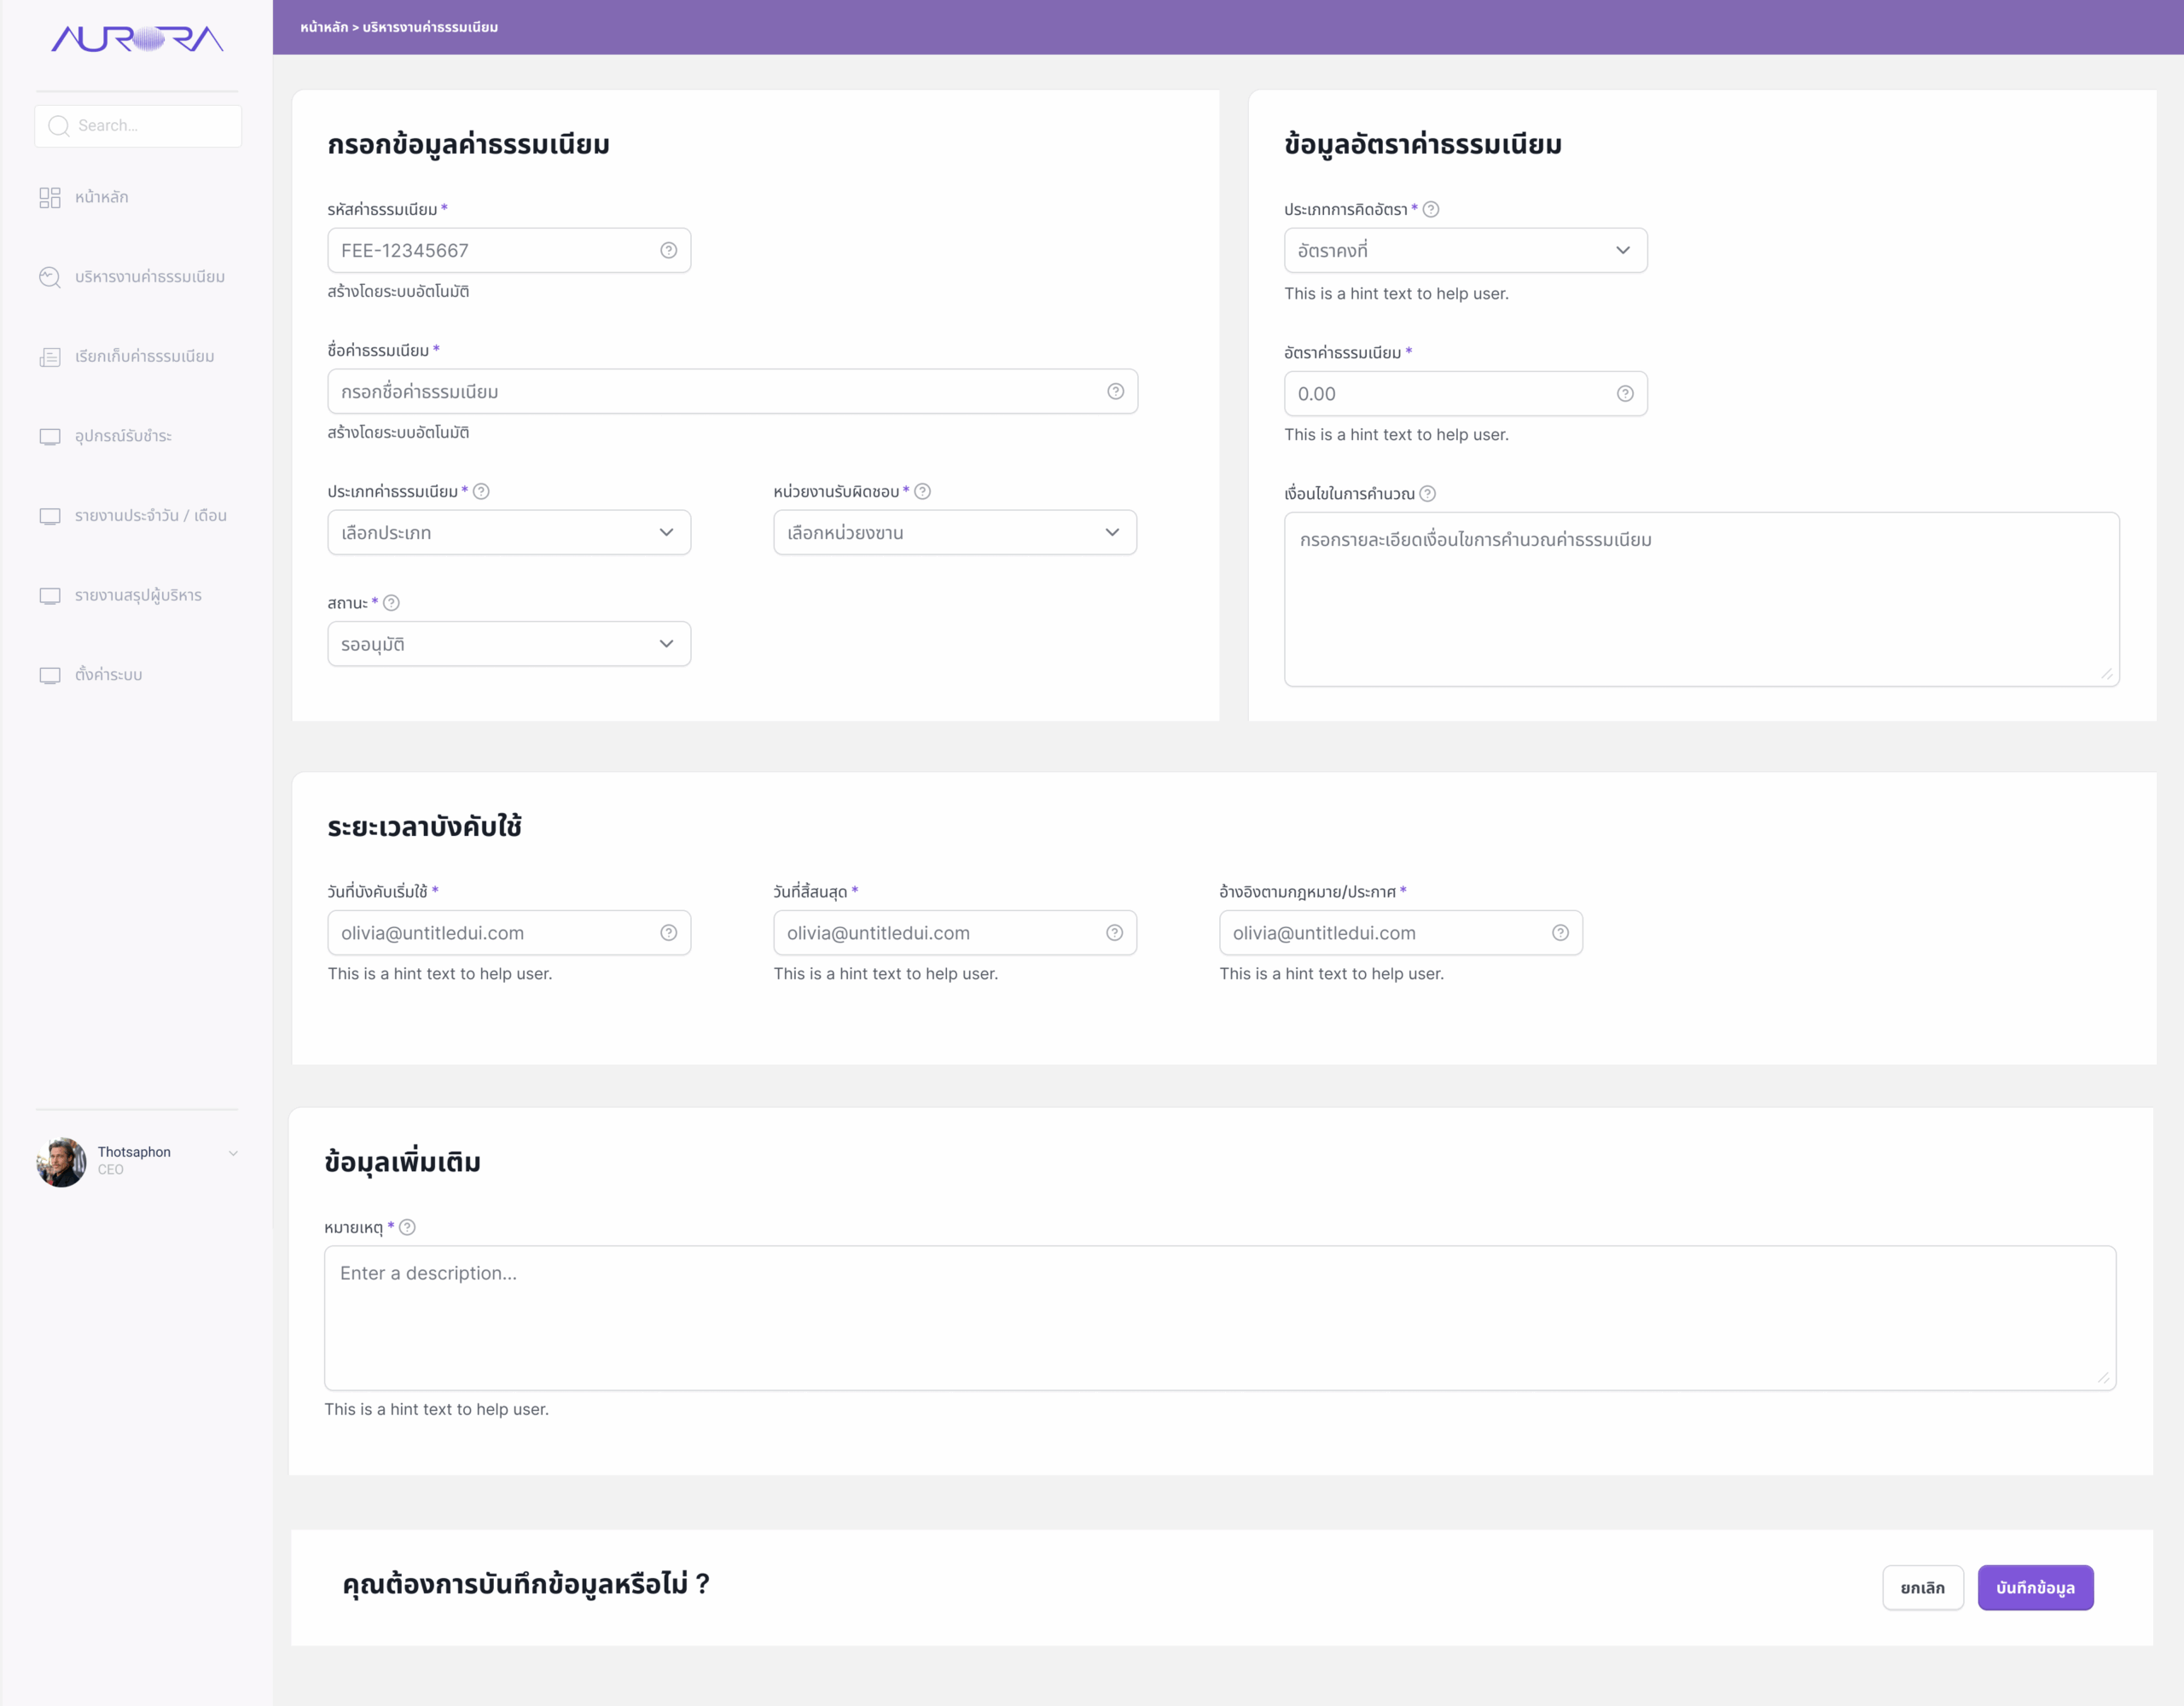
Billing, receipts & invoices
The billing screen tracks every transaction — today's items, total collected today, and items still in progress — with colour-coded status chips for paid, unpaid, pending, and cancelled.
Once a payment is completed, the system automatically generates the official receipt, so there is no separate step where records can fall out of sync.
Screen — เรียกเก็บค่าธรรมเนียม / Fee billing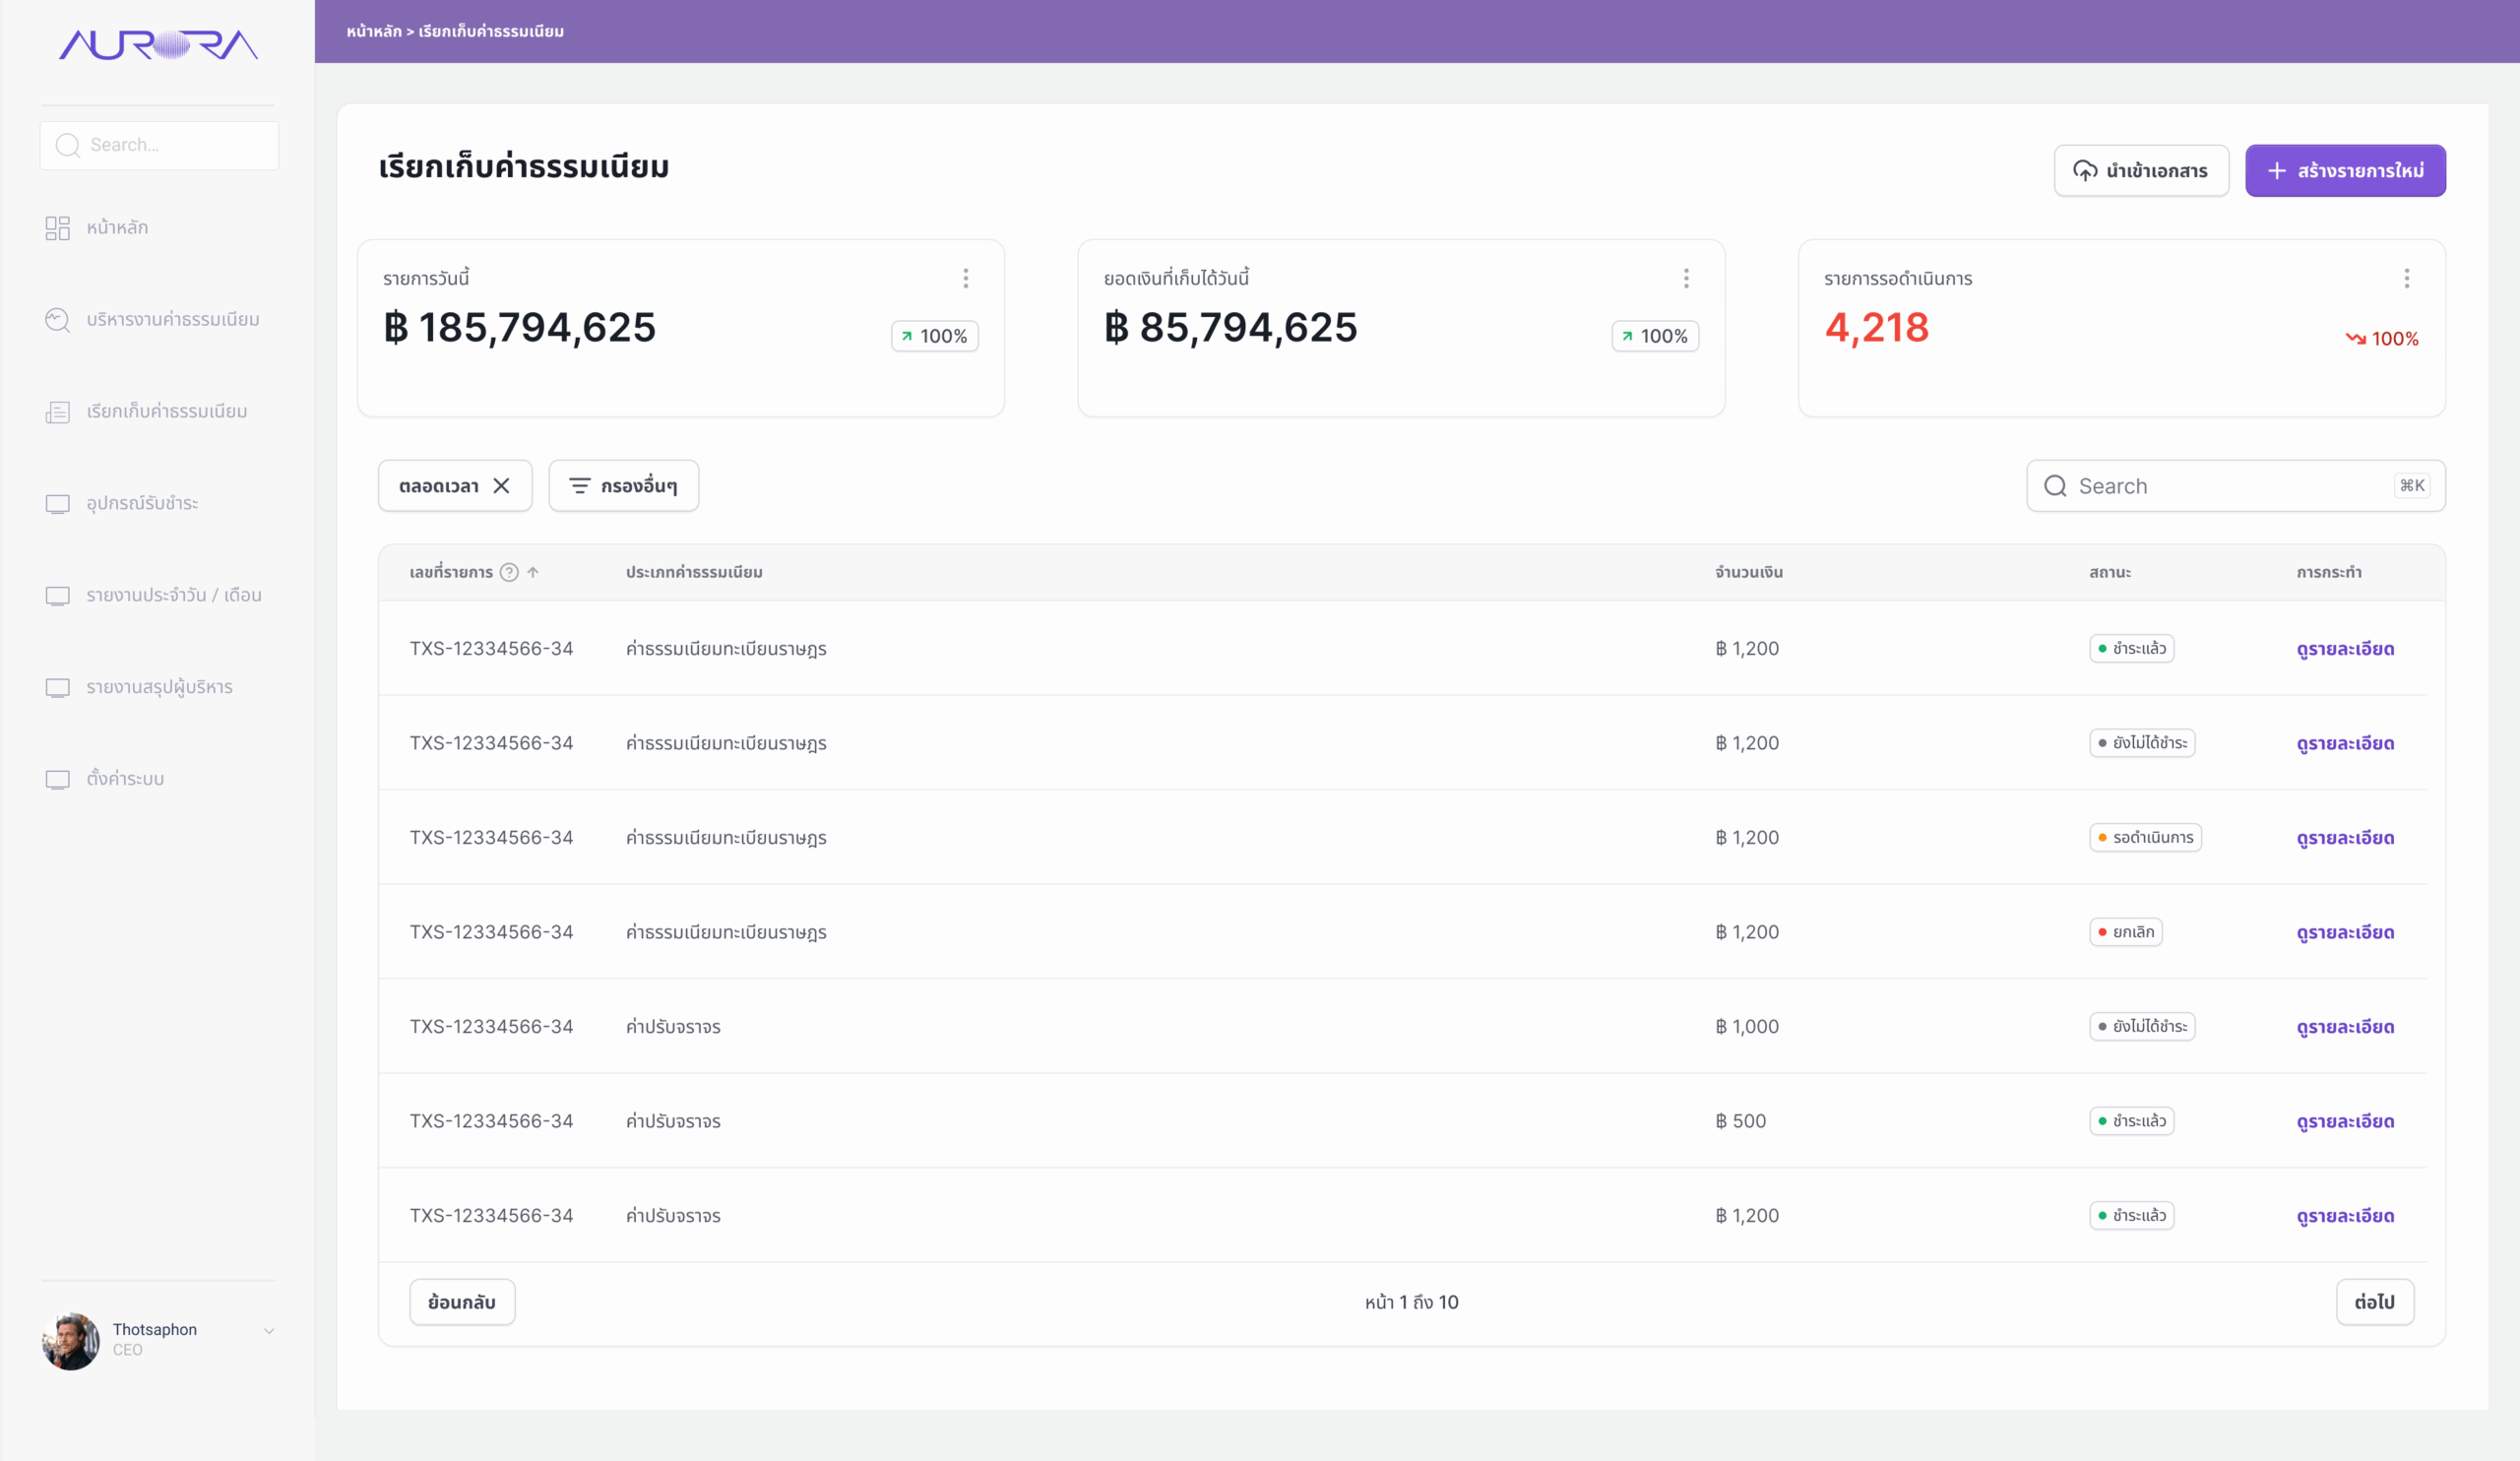
Payment gateway & devices
The system supports multiple payment methods — bank transfer, credit card, and QR code. Payment devices such as EDC terminals and QR payment points are managed from one screen, showing where each is installed and whether it is online, offline, under inspection, or closed.
Tabs switch between all devices, a device map, maintenance, and usage history.
Screen — อุปกรณ์รับชำระ / Payment devices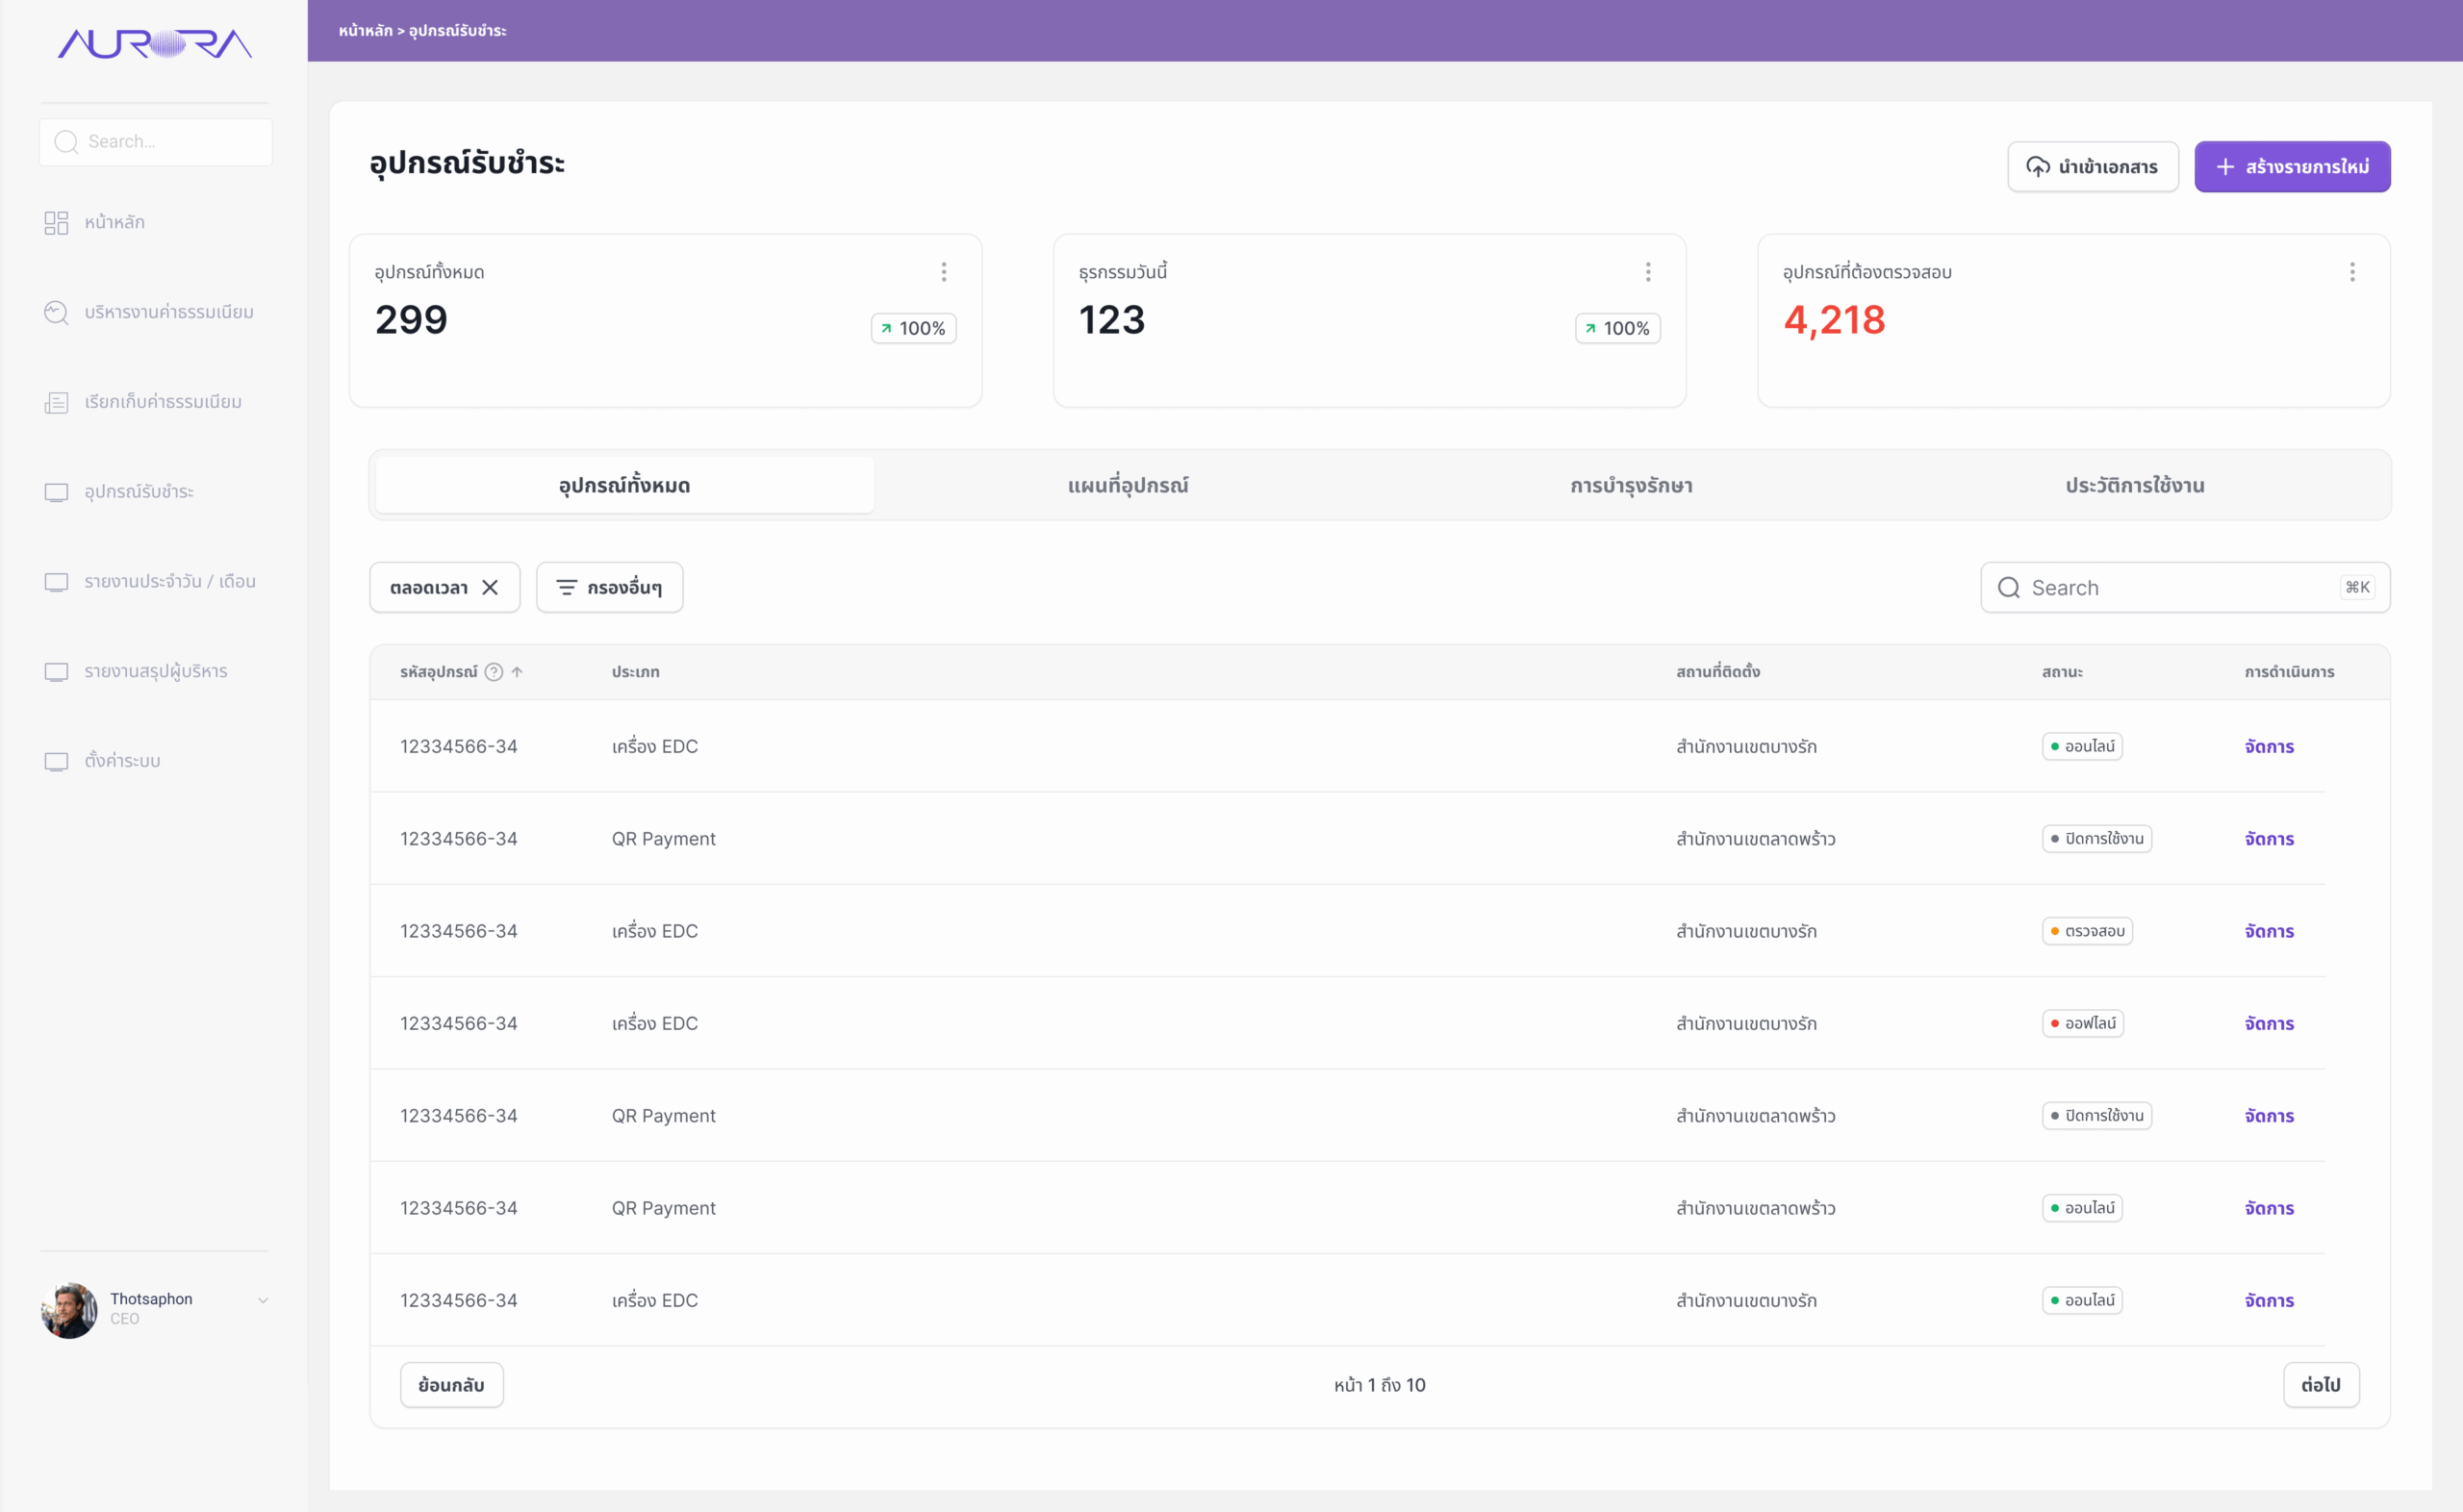
Reporting & analytics
Exportable reports support financial auditing and performance monitoring. Daily, monthly, comparison, and trend reports show total revenue, transaction count, and average value per transaction.
Charts break revenue down by payment channel — credit card, cash, QR code, e-wallet — and highlight the most popular fee types, giving executives answers without waiting for a compiled report.
Screen — รายงานประจำเดือน / วัน / Reports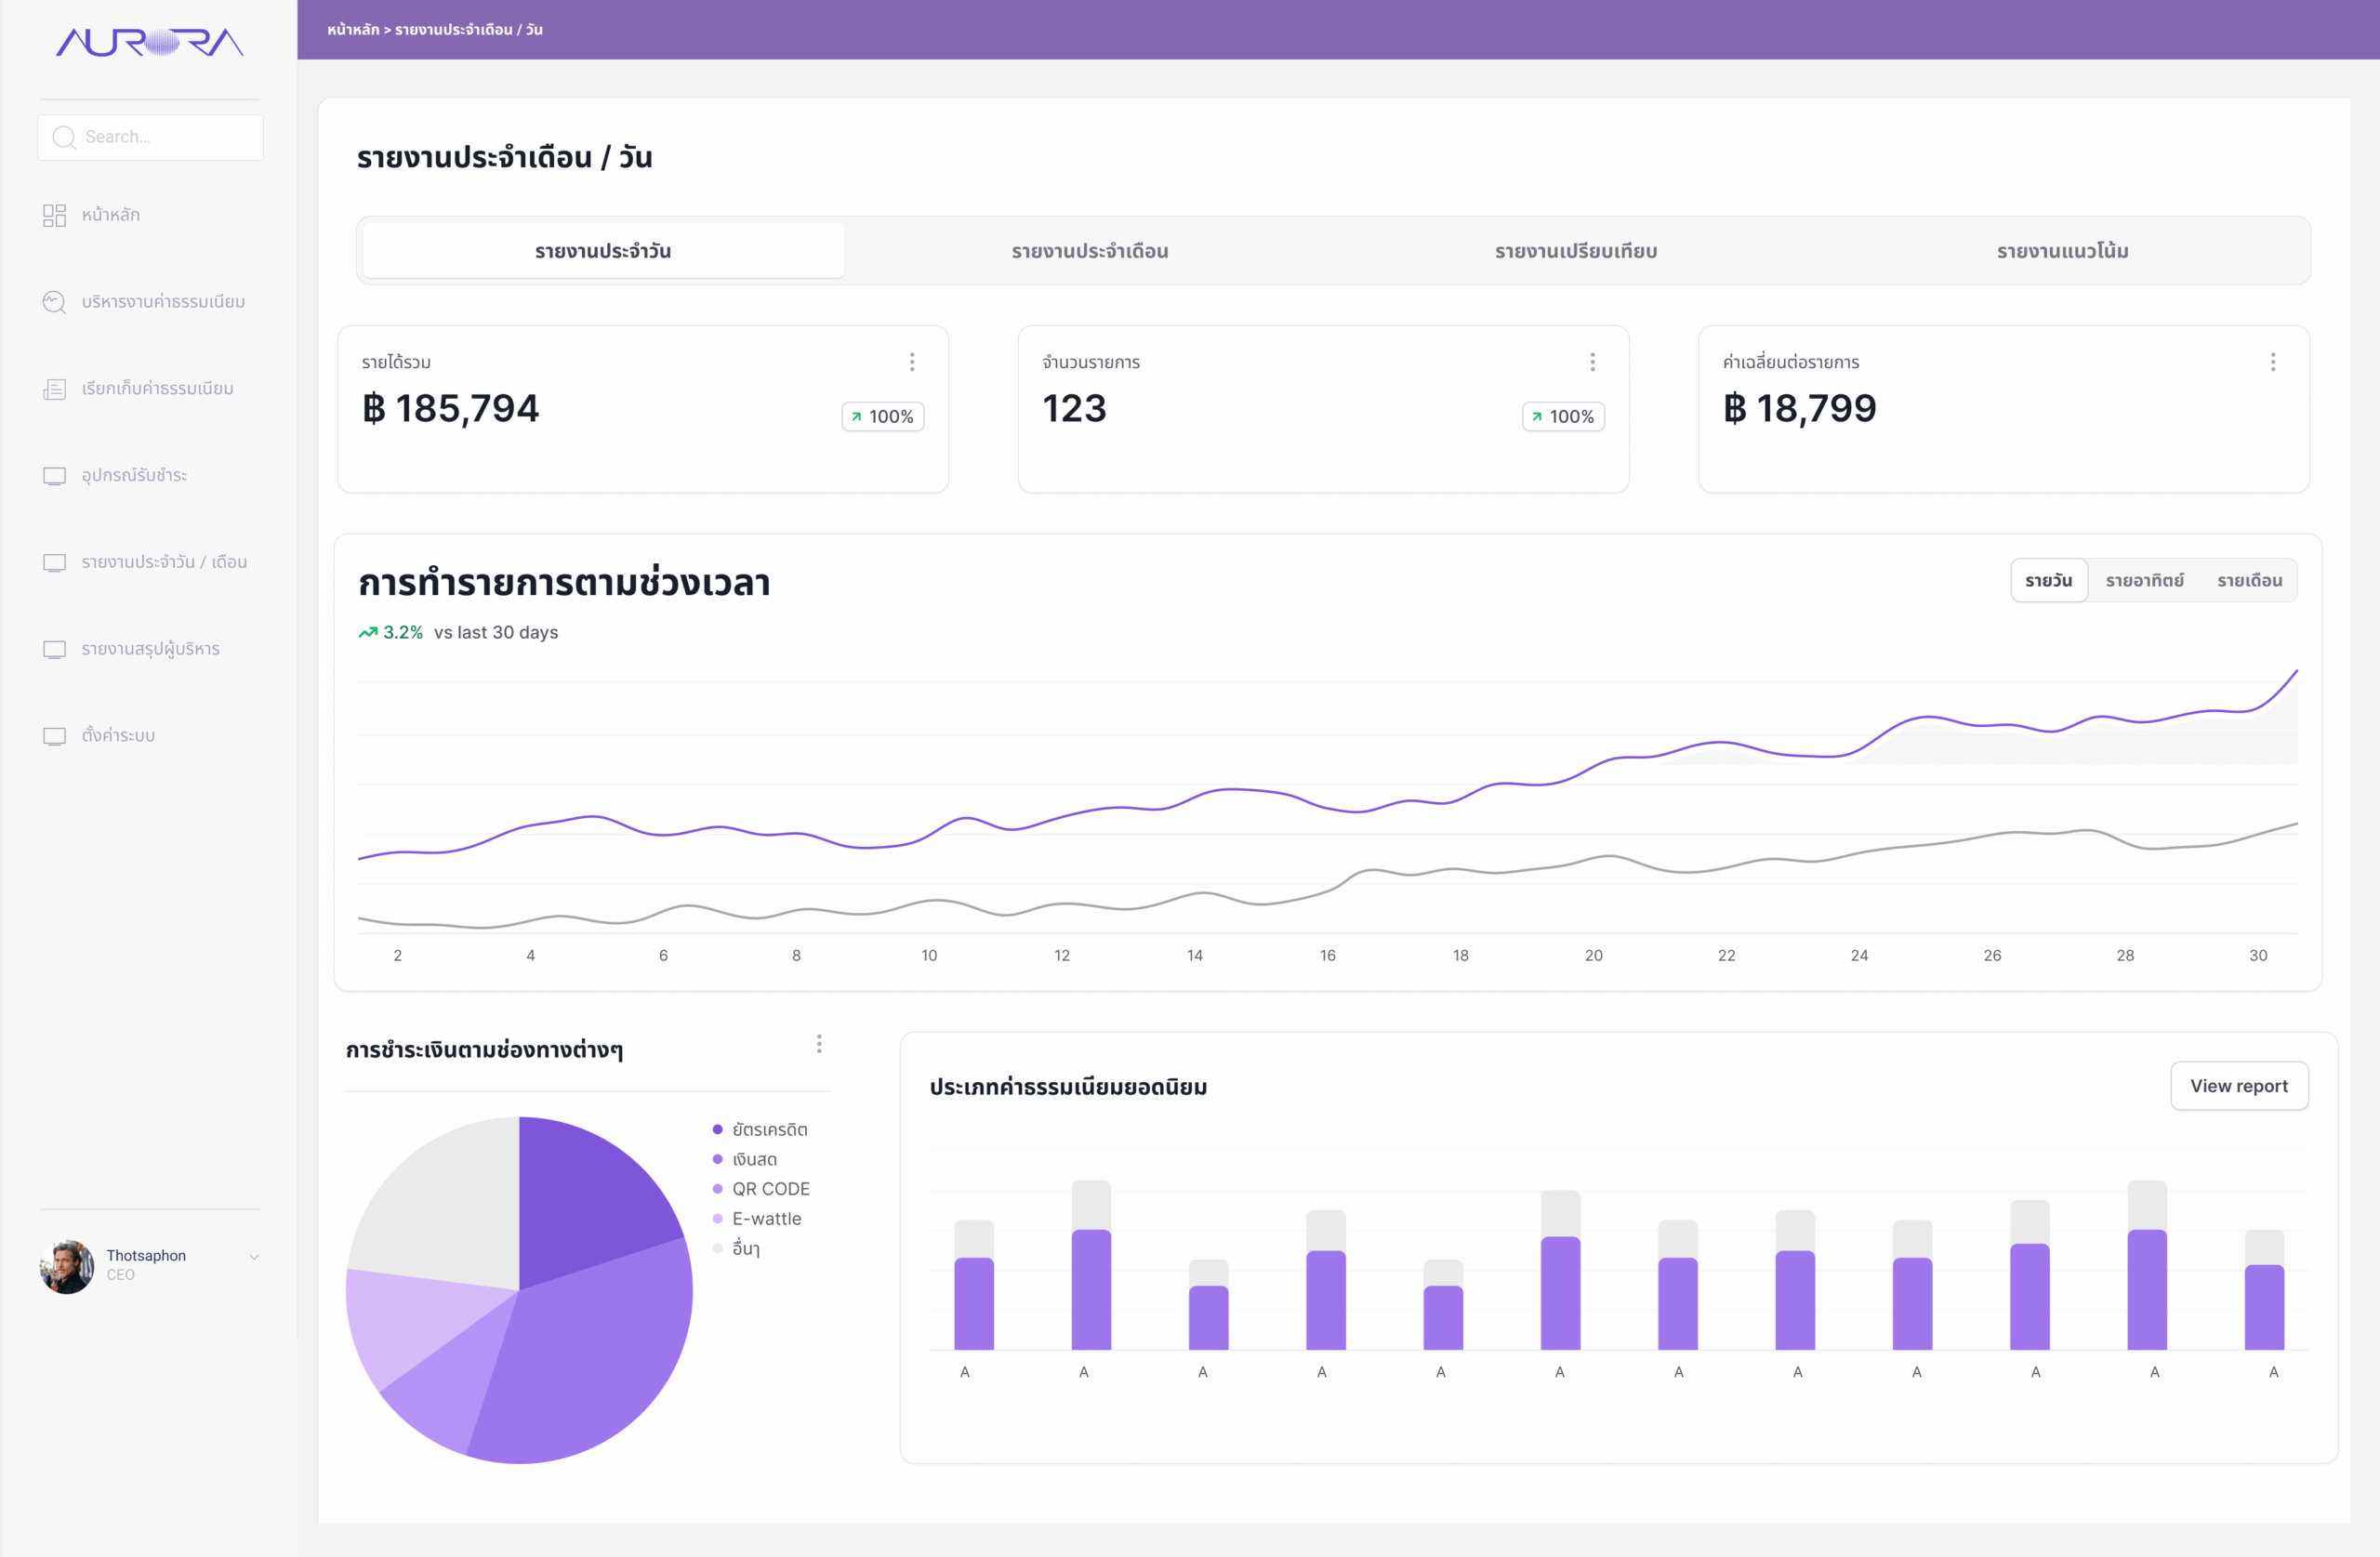
GIS — waste bin locations & collection routes
To connect fees with the service they fund, a GIS module maps every waste bin. Staff filter by bin type (general, recycle, hazardous, organic), size, condition, district, and last inspection date. Bins are colour-coded — normal, needs repair, damaged — and selecting one opens its record with nearby points listed below.
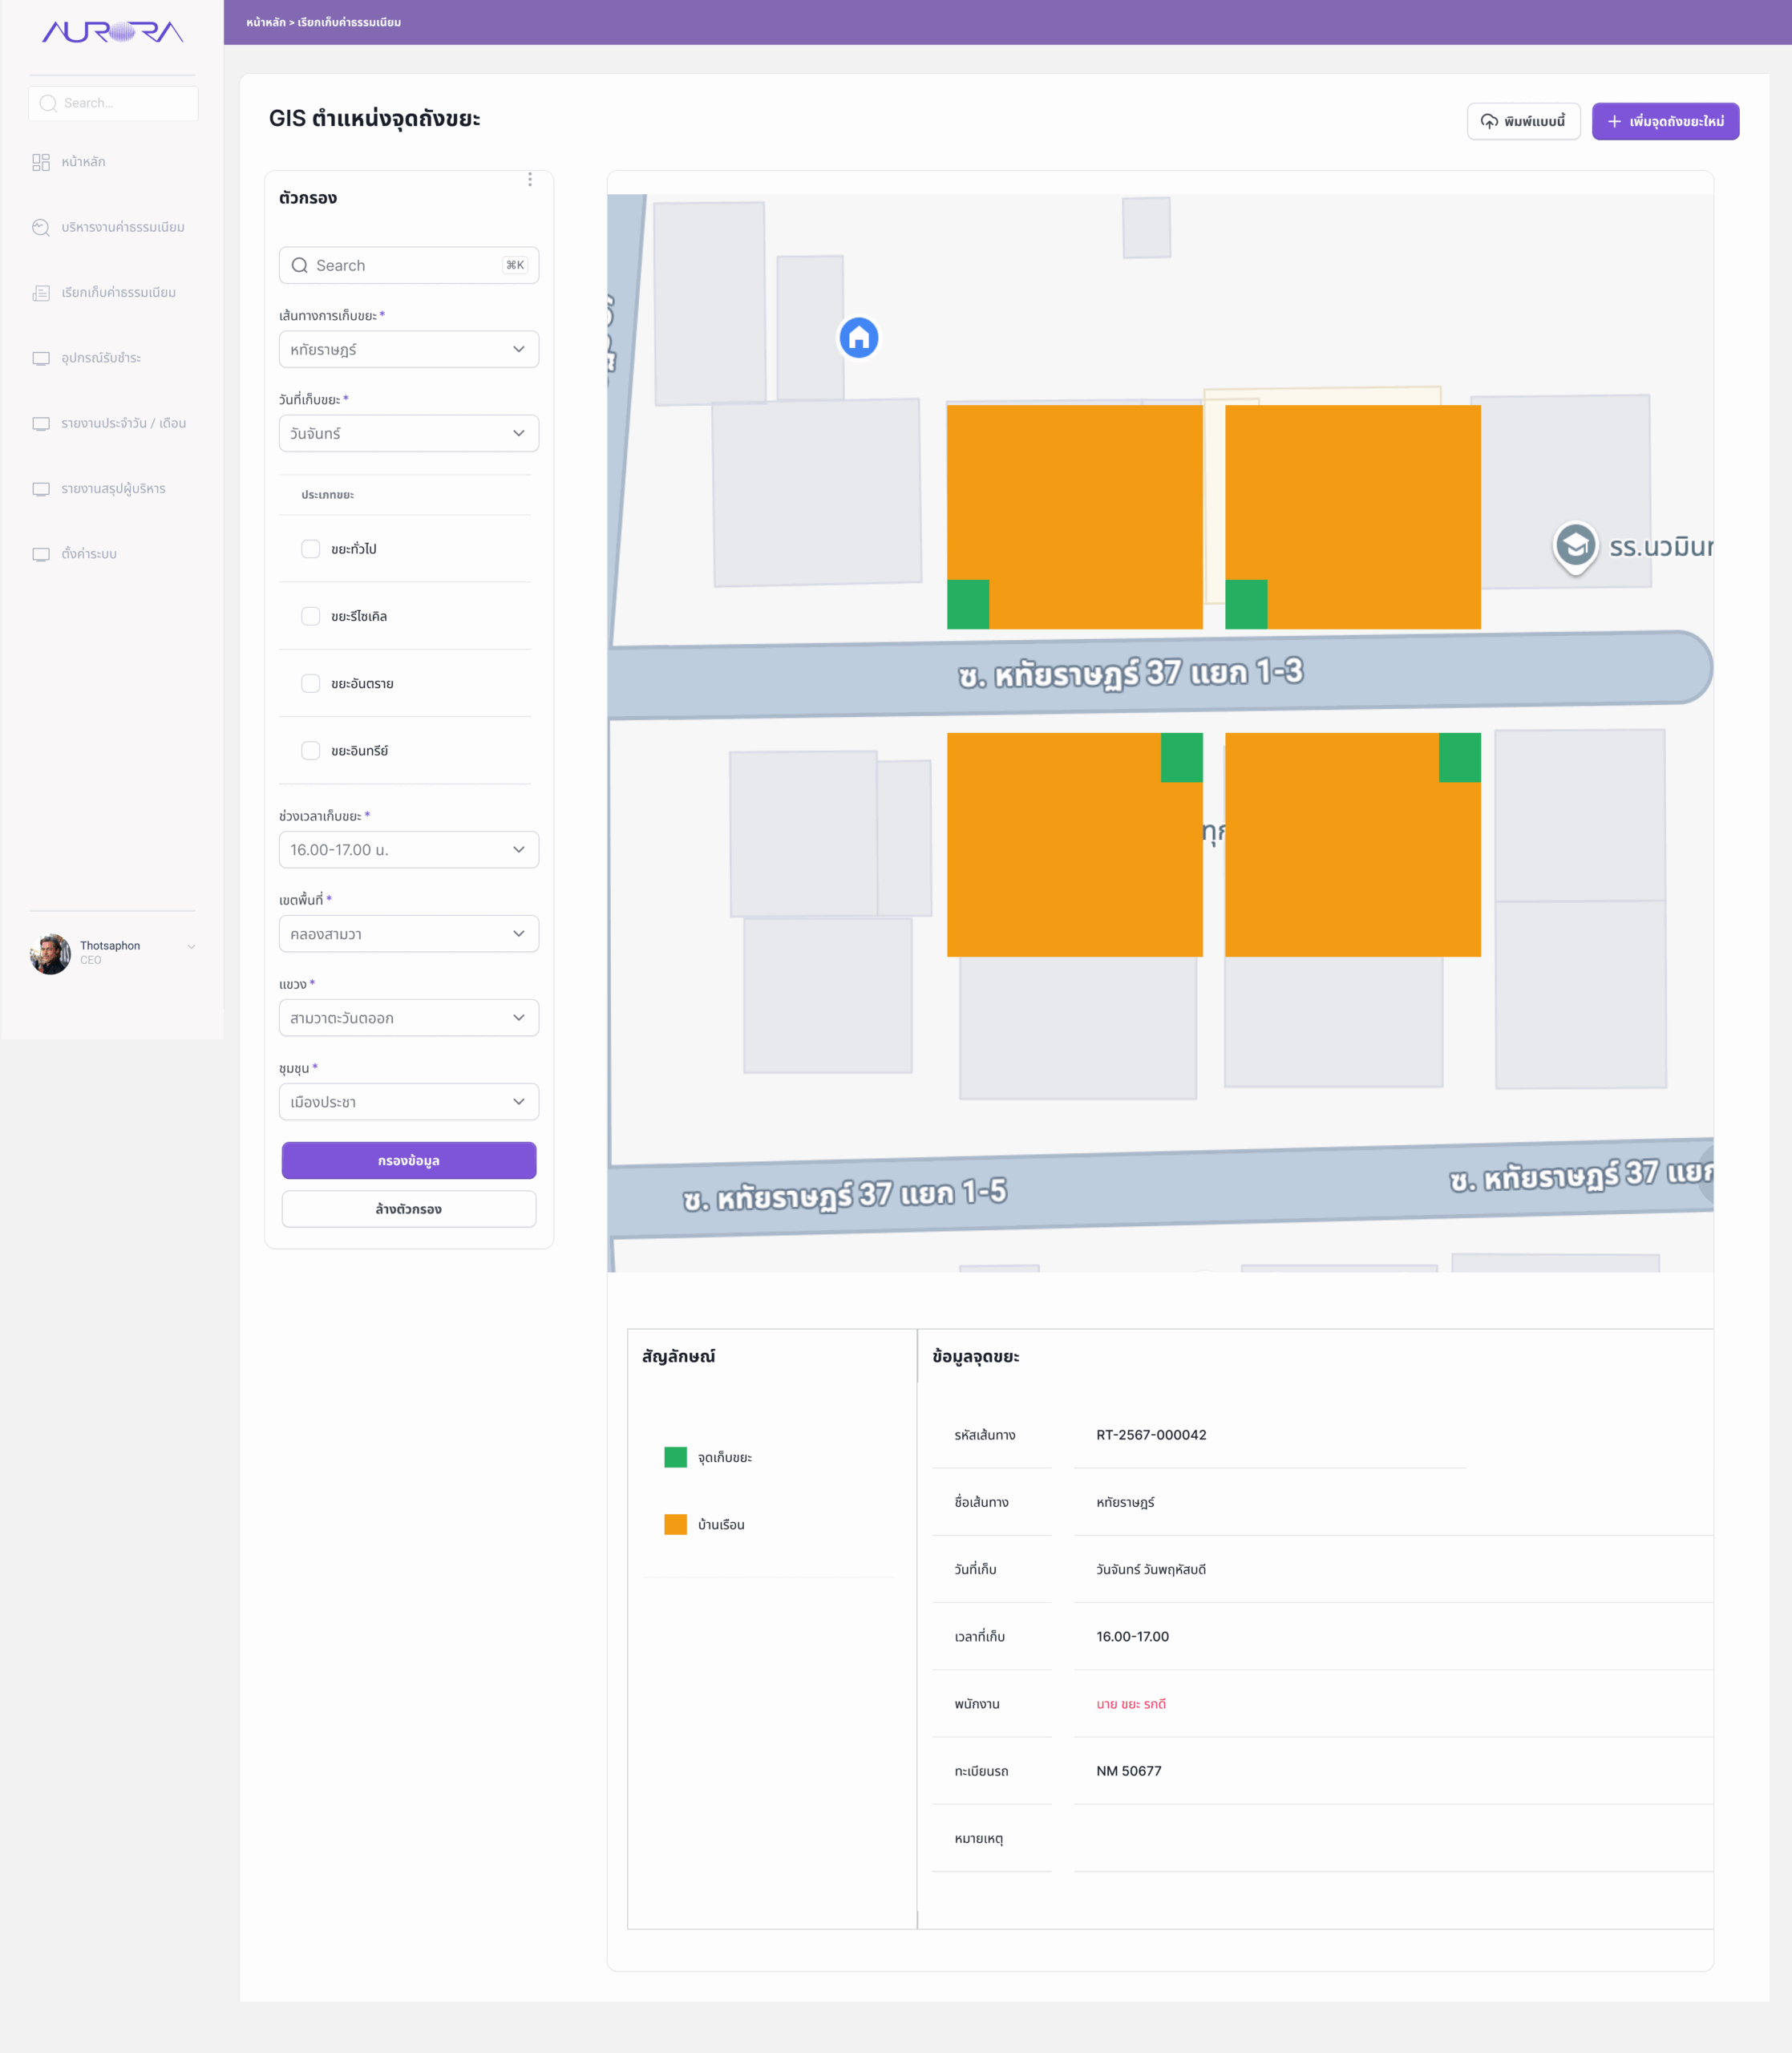
A second view plans collection routes by road, collection day, and time slot, showing collection points against households along each street along with the assigned staff and vehicle.
Screens — GIS ตำแหน่งจุดถังขยะ / Waste bin map and routes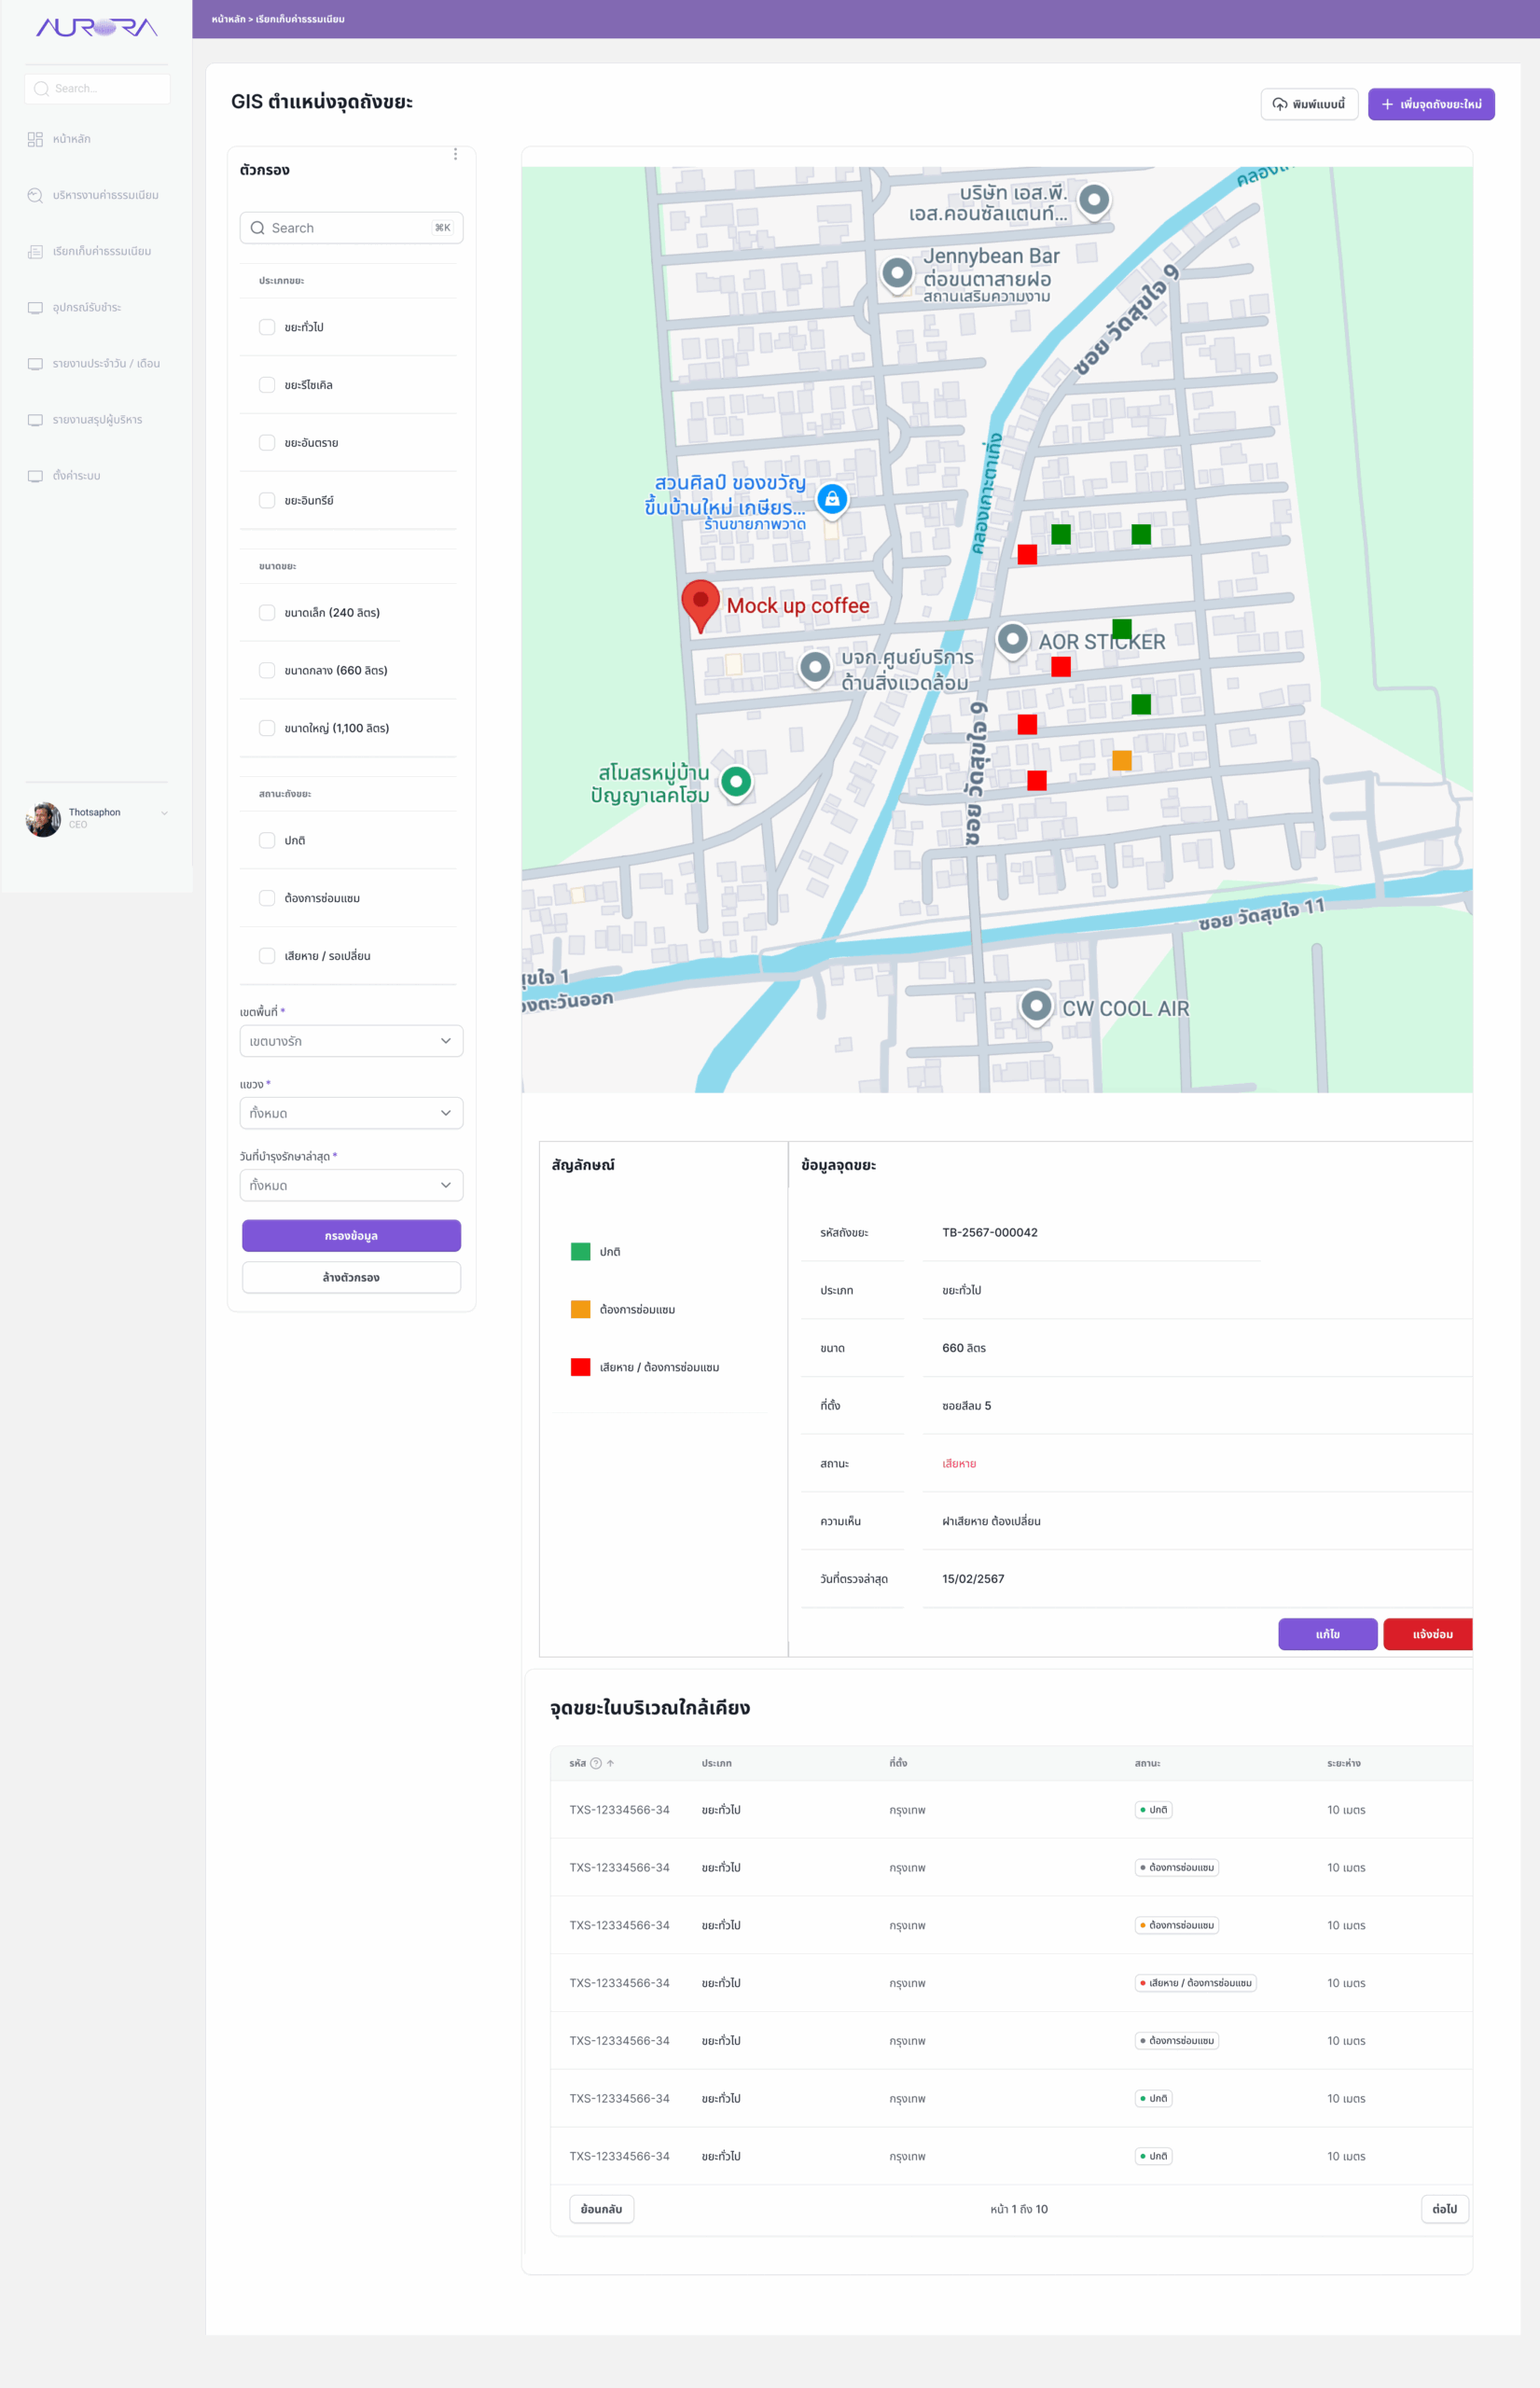
Designed around the people behind every fee.
User-centered design
Research with both staff and end-users defined the pain points and expectations that every screen had to answer.
Information architecture
Intuitive navigation with functions grouped by task, so users find what they need without training.
Wireframing & prototyping
Low-fidelity wireframes and high-fidelity prototypes were iterated and tested with stakeholders.
Responsive design
Optimized for both desktop and mobile, so staff and payers can work from wherever they are.
Impact
Moving fees from manual steps into one rule-based platform made processing faster and more accurate.
- Enhanced financial accuracy and reduced manual calculation errors.
- Payment, receipt, and reporting now happen in one connected flow.
- Executives can see revenue and outstanding items at any time instead of waiting for month-end reports.
Reflection
In a finance system, trust is the real feature. Every design decision came back to one test: can the user see why this number is what it is?
Showing the calculation conditions next to each fee, tying receipts directly to payments, and surfacing items awaiting approval in red all serve that goal. Next, I would extend the payer-facing experience further — a self-service view on mobile where people can check fees, pay, and download receipts without visiting a counter.